
In the equation $S = CA^z$,where $S =$ species richness,$A =$ area,$Z =$ slope of the line,and $C =$ $Y$-intercept. If area is on the $X$-axis and species richness is on the $Y$-axis,what will the graph of $S = CA^z$ look like?
- A
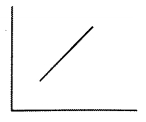
- B
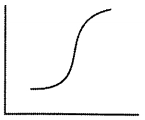
- C
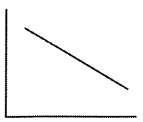
- D
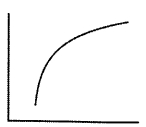
Explore More
Similar Questions
Exploring molecular, genetic and species-level diversity for products of economic importance is called:
Which of the following is also known as the 'Lungs of the Planet'?
Medium
View SolutionGiven below are two statements.
Statement-$I$: Genetic diversity is the diversity in the number and type of genes as well as chromosomes present in the same species and variations in the genes and their alleles.
Statement-$II$: Species diversity deals with the variety of species as well as the number of individuals of different species observed in an area.
In light of the above statements,select the correct answer from the options given below.
Statement-$I$: Genetic diversity is the diversity in the number and type of genes as well as chromosomes present in the same species and variations in the genes and their alleles.
Statement-$II$: Species diversity deals with the variety of species as well as the number of individuals of different species observed in an area.
In light of the above statements,select the correct answer from the options given below.
In India,tropical rain forests are found in . . . . . . .
The Western Ghats have a greater diversity of which species compared to the Eastern Ghats?
Medium
View SolutionVedclass Products
For Students
Vedclass Test Series
Mock tests in real JEE/NEET style with performance analysis. 5-day free trial.
Start Free TrialFor Teachers
Exam Paper Generator
Generate Set A/B/C/D exam papers from 7.5L+ questions in 2 minutes. 3 chapters free.
Try FreeFor Institutes
Online Exam Module
Live online exams with unlimited students, 360° analytics & white-label branding.
See Demo