
Given $S =$ species richness,$A =$ area,$Z =$ slope of the line,and $C =$ $Y$-intercept. If area is on the $X$-axis and species richness is on the $Y$-axis,what will the graph of $\log S = \log C + Z \log A$ look like?
- A
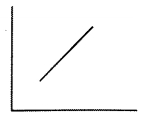
- B
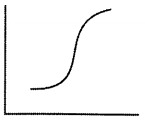
- C
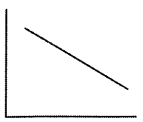
- D
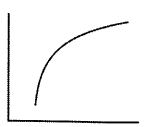
Explore More
Similar Questions
Which of the following statements is incorrect regarding tropical environments?
Medium
View SolutionWhat is biodiversity? Describe the different patterns of biodiversity with examples.
Medium
View SolutionWhat is/are the correct explanations for higher diversity in tropical areas in comparison to temperate areas?
$I$. There are no unfavourable seasons in the tropics
$II$. Less solar energy is available in the tropics
$III$. Rate of extinction is low in the tropics
$IV$. Resource availability is higher in the tropics
Choose the correct option.
$I$. There are no unfavourable seasons in the tropics
$II$. Less solar energy is available in the tropics
$III$. Rate of extinction is low in the tropics
$IV$. Resource availability is higher in the tropics
Choose the correct option.
Medium
View SolutionAccording to the hypothesis proposed by environmental biologists,a relatively constant environment in the tropics promotes:
Identify the correct statement.
Medium
View SolutionVedclass Products
For Students
Vedclass Test Series
Mock tests in real JEE/NEET style with performance analysis. 5-day free trial.
Start Free TrialFor Teachers
Exam Paper Generator
Generate Set A/B/C/D exam papers from 7.5L+ questions in 2 minutes. 3 chapters free.
Try FreeFor Institutes
Online Exam Module
Live online exams with unlimited students, 360° analytics & white-label branding.
See Demo