
Which of the following graphs represents a first-order reaction?
- A
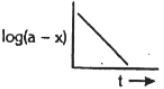
- B
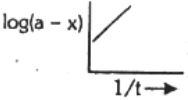
- C
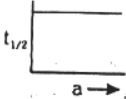
- DBoth $A$ and $C$.
Explore More
Similar Questions
What is the numerical value of the rate constant of a first-order reaction that is $20 \%$ completed in $10 \ min$ (in $min^{-1}$)?
In a first-order reaction,the concentration of reactant $X$ decreases from $0.1 \, M$ to $0.005 \, M$ in $40 \, min$. What will be the rate of reaction when the concentration of $X$ is $0.01 \, M$?
Difficult
View SolutionThe slope of the graph between rate ($Y$-axis) and $[A]$ ($X$-axis) for a first-order reaction is equal to:
Calculate the half-life period of a first-order reaction if the rate constant of the reaction is $0.02 \ min^{-1}$. (in $min$)
The time taken for $10 \%$ completion of a first order reaction is $20 \ min$. Then, for $19 \%$ completion, the reaction will take (in $min$)
DifficultWBJEE 2009
View SolutionVedclass Products
For Students
Vedclass Test Series
Mock tests in real JEE/NEET style with performance analysis. 5-day free trial.
Start Free TrialFor Teachers
Exam Paper Generator
Generate Set A/B/C/D exam papers from 7.5L+ questions in 2 minutes. 3 chapters free.
Try FreeFor Institutes
Online Exam Module
Live online exams with unlimited students, 360° analytics & white-label branding.
See Demo