
In an experiment,electrons are passed through a narrow slit of width $d$ equal to their de Broglie wavelength. They are detected on a screen at a distance $D$ from the slit. Which of the following graphs represents the number of electrons $N$ detected as a function of the detector position $y$ ($y = 0$ corresponds to the middle of the slit)?
- A
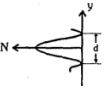
- B
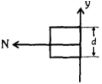
- C
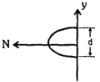
- D

Explore More
Similar Questions
The bending of a beam of light around the corners of obstacles is called
Easy
View SolutionWhat happens if we close one slit in a Young's double-slit experiment?
Medium
View Solution$A$ slit of size $0.15 \ cm$ is placed at $2.1 \ m$ from a screen. On illuminating it by a light of wavelength $5 \times 10^{-5} \ cm$,the width of the central maxima will be:
Difficult
View SolutionRed light is generally used to observe the diffraction pattern from a single slit. If blue light is used instead of red light,then the diffraction pattern:
Easy
View SolutionThe angular width of the central maximum in a single-slit diffraction pattern does not depend on .........
Easy
View SolutionVedclass Products
For Students
Vedclass Test Series
Mock tests in real JEE/NEET style with performance analysis. 5-day free trial.
Start Free TrialFor Teachers
Exam Paper Generator
Generate Set A/B/C/D exam papers from 7.5L+ questions in 2 minutes. 3 chapters free.
Try FreeFor Institutes
Online Exam Module
Live online exams with unlimited students, 360° analytics & white-label branding.
See Demo