
Medium
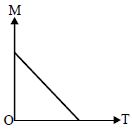
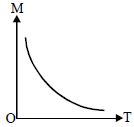
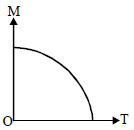
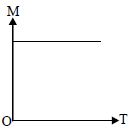
Which of the following curves represents the variation of magnetic moment $(M)$ with temperature $(T)$ for a ferromagnetic material?
- A$A$ linear decrease of $M$ with $T$ reaching zero at the Curie temperature.
- B$A$ hyperbolic decrease of $M$ with $T$.
- C$A$ non-linear decrease of $M$ with $T$ reaching zero at the Curie temperature.
- D$A$ constant value of $M$ with $T$.
Explore More
Similar Questions
The following plots show Magnetization $(M)$ vs Magnetising field $(H)$ and Magnetic susceptibility $(\chi)$ vs temperature $(T)$ graphs:
Which of the following combinations will be represented by a diamagnetic material?
Which of the following combinations will be represented by a diamagnetic material?
$A$ paramagnetic sample shows a net magnetisation of $8 \text{ Am}^{-1}$ when placed in an external magnetic field of $0.6 \text{ T}$ at a temperature of $4 \text{ K}$. When the same sample is placed in an external magnetic field of $0.2 \text{ T}$ at a temperature of $16 \text{ K}$,the magnetisation will be
MediumKCET 2020
View SolutionThe most appropriate magnetization $M$ versus magnetising field $H$ curve for a paramagnetic substance is
Easy
View Solution$A$ proton has spin and magnetic moment just like an electron. Why then is its effect neglected in the magnetism of materials?
Medium
View Solution$A$ soft ferromagnetic material is placed in an external magnetic field. The magnetic domains:
Vedclass Products
For Students
Vedclass Test Series
Mock tests in real JEE/NEET style with performance analysis. 5-day free trial.
Start Free TrialFor Teachers
Exam Paper Generator
Generate Set A/B/C/D exam papers from 7.5L+ questions in 2 minutes. 3 chapters free.
Try FreeFor Institutes
Online Exam Module
Live online exams with unlimited students, 360° analytics & white-label branding.
See Demo