
$A$ flexible wire bent in the form of a circle is placed in a uniform magnetic field perpendicular to the plane of the coil. The radius of the coil changes as shown in the figure. The graph of induced $emf$ in the coil is represented by
- A
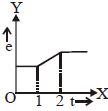
- B
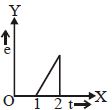
- C
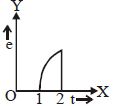
- D
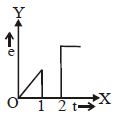
Explore More
Similar Questions
$A$ coil is placed in a time-varying magnetic field. If the number of turns in the coil were to be halved and the radius of the wire doubled,the electrical power dissipated due to the current induced in the coil would be: (Assume the coil to be short-circuited.)
$A$ coil of wire having finite inductance and resistance has a conducting ring placed coaxially within it. The coil is connected to a battery at time $t = 0$,so that a time-dependent current $I_1(t)$ starts flowing through the coil. If $I_2(t)$ is the current induced in the ring and $B(t)$ is the magnetic field at the axis of the coil due to $I_1(t)$,then as a function of time $(t > 0)$,the product $I_2(t) B(t)$:
DifficultIIT 2000
View SolutionThe bob of a simple pendulum is replaced by a magnet. The oscillations are set along the length of the magnet. $A$ copper coil is added so that one pole of the magnet passes in and out of the coil. The coil is short-circuited. Then which one of the following happens?
Easy
View SolutionIn an $L-R$ circuit connected to a battery of constant $e.m.f.$ $E$,switch $S$ is closed at time $t = 0$. If $e$ denotes the magnitude of induced $e.m.f.$ across the inductor and $i$ the current in the circuit at any time $t$,then which of the following graphs shows the variation of $e$ with $i$?
Medium
View Solution$A$ conducting square loop initially lies in the $XZ$ plane with its lower edge hinged along the $X$-axis. Only in the region $y \geq 0$,there is a time-dependent magnetic field pointing along the $Z$-direction,$\vec{B}(t) = B_0(\cos \omega t) \hat{k}$,where $B_0$ is a constant. The magnetic field is zero everywhere else. At time $t=0$,the loop starts rotating with constant angular speed $\omega$ about the $X$-axis in the clockwise direction as viewed from the $+X$ axis (as shown in the figure). Ignoring self-inductance of the loop and gravity,which of the following plots correctly represents the induced e.m.f. $(V)$ in the loop as a function of time?
Vedclass Products
For Students
Vedclass Test Series
Mock tests in real JEE/NEET style with performance analysis. 5-day free trial.
Start Free TrialFor Teachers
Exam Paper Generator
Generate Set A/B/C/D exam papers from 7.5L+ questions in 2 minutes. 3 chapters free.
Try FreeFor Institutes
Online Exam Module
Live online exams with unlimited students, 360° analytics & white-label branding.
See Demo