
Class 12PhysicsDual Nature of Radiation and MatterPhotoelectric Effect by Lenard and it's Observations
Medium$A$ point source causes the photoelectric effect from a small metal plate. Which of the following curves may represent the saturation photocurrent $(I)$ as a function of the distance $(r)$ between the source and the metal?
- A
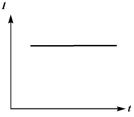
- B
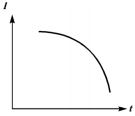
- C
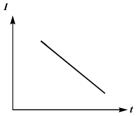
- D
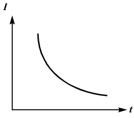
Explore More
Similar Questions
The graph between the intensity of light $(I)$ falling on a metallic plate and the generated photoelectric current $(i)$ is:
Easy
View Solution$A$ photoelectric cell is illuminated by a point source of light kept at a distance $d$. If the distance is reduced to $d/2$,then the number of electrons emitted per second will be:
Medium
View Solution$A$ photocell is receiving light from a source placed at a distance of $1 \ m$. If the same source is placed at a distance of $2 \ m$,then the ejected electrons:
Easy
View SolutionFor most metals, threshold frequencies lie in which region?
Medium
View SolutionThe electrons are emitted in the photoelectric effect from a metal surface:
Easy
View SolutionVedclass Products
For Students
Vedclass Test Series
Mock tests in real JEE/NEET style with performance analysis. 5-day free trial.
Start Free TrialFor Teachers
Exam Paper Generator
Generate Set A/B/C/D exam papers from 7.5L+ questions in 2 minutes. 3 chapters free.
Try FreeFor Institutes
Online Exam Module
Live online exams with unlimited students, 360° analytics & white-label branding.
See Demo