
Class 11Physics1 Thermal Properties of Matter: Thermometry, Expansion and CalorimetryHeat Capacity, Specific Heat and Molar Specific Heat
DifficultAt temperatures close to $0\ K$, the heat capacity $C$ of a certain solid is related to its temperature $T$ by the equation $C = aT^3$, where $a$ is a constant characteristic of the solid. Heat is supplied to the solid at a steady rate. Which graph best represents the variation of its temperature $T$ with time $t$?
- A
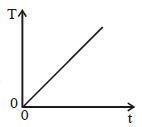
- B
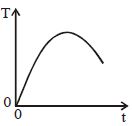
- C
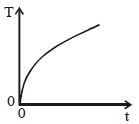
- D
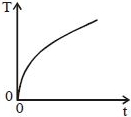
Explore More
Similar Questions
Thermal capacity of a body depends on
Easy
View SolutionWhy is water used as a coolant in automobile radiators?
Medium
View SolutionWhich of the following statements is $NOT$ true?
Why are the winds coming from the sea cool in summer?
Easy
View SolutionOn what factors does the required amount of heat depend to heat a given substance?
Easy
View SolutionVedclass Products
For Students
Vedclass Test Series
Mock tests in real JEE/NEET style with performance analysis. 5-day free trial.
Start Free TrialFor Teachers
Exam Paper Generator
Generate Set A/B/C/D exam papers from 7.5L+ questions in 2 minutes. 3 chapters free.
Try FreeFor Institutes
Online Exam Module
Live online exams with unlimited students, 360° analytics & white-label branding.
See Demo