
Difficult
Consider a solution of $CO_{2(g)}$ dissolved in water in a closed container. Which one of the following plots correctly represents the variation of $log$ (partial pressure of $CO_2$ in vapour phase above water) [y-axis] with $log$ (mole fraction of $CO_2$ in water) [x-axis] at $25^{\circ}C$?
- A
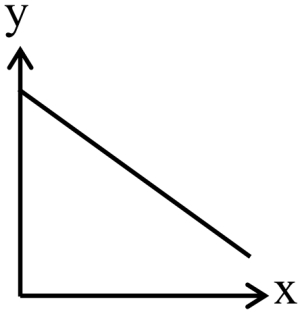
- B
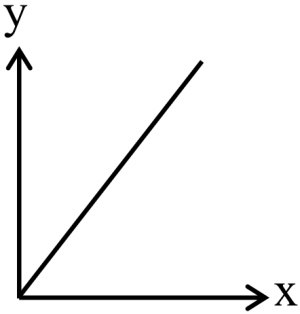
- C
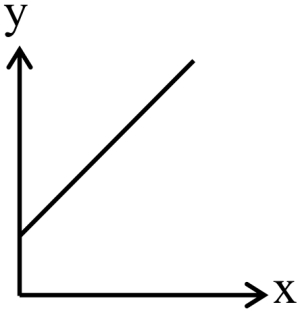
- D
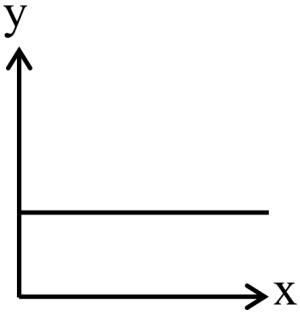
Explore More
Similar Questions
If $O_2$ gas is bubbled through water at $303 \; K$,the number of millimoles of $O_2$ gas that dissolve in $1 \; L$ of water is (Nearest Integer). (Given: Henry's Law constant for $O_2$ at $303 \; K$ is $46.82 \; kbar$ and partial pressure of $O_2 = 0.920 \; bar$). (Assume solubility of $O_2$ in water is too small,nearly negligible).
Which one of the following statements regarding Henry's law is not correct?
Which of the following ionic solids exhibits a decrease in its solubility in water with an increase in temperature?
The solubility of a gas in a liquid is directly proportional to the pressure of the gas over the solution. Identify the law for this statement.
Which of the following statements is $NOT$ true about solubility?
Vedclass Products
For Students
Vedclass Test Series
Mock tests in real JEE/NEET style with performance analysis. 5-day free trial.
Start Free TrialFor Teachers
Exam Paper Generator
Generate Set A/B/C/D exam papers from 7.5L+ questions in 2 minutes. 3 chapters free.
Try FreeFor Institutes
Online Exam Module
Live online exams with unlimited students, 360° analytics & white-label branding.
See Demo