
Class 11Physics2 Thermal Properties of Matter: Heat TransferRadiation (General, Kirchoff's law, Black body, Prevost's Theory)
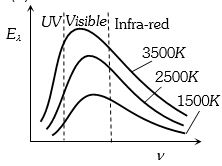
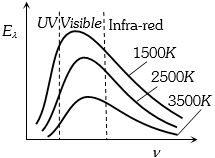
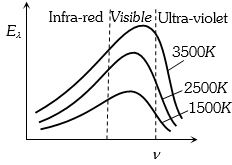
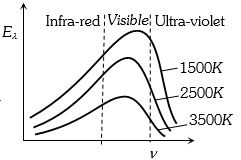
MediumThe following graph shows the correct variation in the intensity of heat radiations emitted by a black body with respect to frequency at different fixed temperatures. Identify the correct graph.
- A
- B
- C
- D
Explore More
Similar Questions
$A$ certain substance emits only the wavelengths ${\lambda _1}, {\lambda _2}, {\lambda _3}$ and ${\lambda _4}$ when it is at a high temperature. When this substance is at a colder temperature,it will absorb only the following wavelengths:
Easy
View Solution$A$ total radiation of $400 \ J$ is incident on a body. If $20\%$ of the radiation is reflected and $120 \ J$ is absorbed,find the percentage of the transmittive power.
Easy
View SolutionSelect the incorrect statement.
Easy
View SolutionWhich of the following statements is wrong?
Easy
View SolutionFor an opaque body,the coefficient of transmission is:
Vedclass Products
For Students
Vedclass Test Series
Mock tests in real JEE/NEET style with performance analysis. 5-day free trial.
Start Free TrialFor Teachers
Exam Paper Generator
Generate Set A/B/C/D exam papers from 7.5L+ questions in 2 minutes. 3 chapters free.
Try FreeFor Institutes
Online Exam Module
Live online exams with unlimited students, 360° analytics & white-label branding.
See Demo