
Class 11Physics1 Thermal Properties of Matter: Thermometry, Expansion and CalorimetryLatent Heat and Heating Curve
MediumLiquid oxygen at $50\ K$ is heated to $300\ K$ at a constant pressure of $1\ atm$. The rate of heating is constant. Which of the following graphs represents the variation of temperature with time?
- A
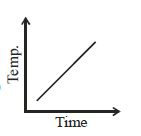
- B
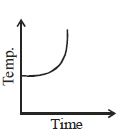
- C
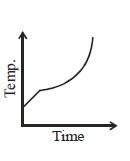
- D
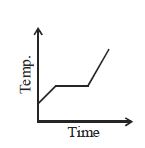
Explore More
Similar Questions
$A$ quantity of heat required to change the unit mass of a solid substance,from solid state to liquid state,while the temperature remains constant,is known as
Boiling water is changing into steam. At this stage,the specific heat of water is
Easy
View Solution$Assertion :$ Melting of a solid causes no change in internal energy.
$Reason :$ Latent heat is the heat required to melt a unit mass of a solid.
$Reason :$ Latent heat is the heat required to melt a unit mass of a solid.
Heat is supplied to a certain homogeneous sample of matter at a uniform rate. Its temperature is plotted against time,as shown. Which of the following conclusions can be drawn?
Medium
View SolutionWhen $0.93 \, W \cdot h$ of energy is supplied to a block of ice weighing $10 \, g,$ it is found that
Medium
View SolutionVedclass Products
For Students
Vedclass Test Series
Mock tests in real JEE/NEET style with performance analysis. 5-day free trial.
Start Free TrialFor Teachers
Exam Paper Generator
Generate Set A/B/C/D exam papers from 7.5L+ questions in 2 minutes. 3 chapters free.
Try FreeFor Institutes
Online Exam Module
Live online exams with unlimited students, 360° analytics & white-label branding.
See Demo