
The current $i$ in an inductance coil varies with time $t$ according to the following graph. Which of the following plots shows the variation of voltage $V$ in the coil?
- A
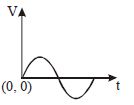
- B
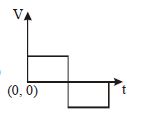
- C
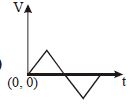
- D
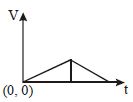
Explore More
Similar Questions
$A$ current $I = 10 \ A$ is passed through the part of a circuit shown in the figure. What will be the potential difference between $A$ and $B$ when $I$ is decreased at a constant rate of $10^2 \ A \ s^{-1}$ (in $V$)?
DifficultAP EAMCET 2020
View SolutionThe switches in figures $(a)$ and $(b)$ are closed at $t = 0$.
Medium
View Solution$A$ conducting circular loop of resistance $20 \Omega$ and cross-sectional area $20 \times 10^{-2} \,m^{2}$ is placed perpendicular to a spatially uniform magnetic field $B$, which varies with time $t$ as $B = 2 \sin(50 \pi t) \,T$. Find the net charge flowing through the loop in $20 \,ms$ starting from $t = 0$. (in $\,C$)
MediumWBJEE 2020
View Solution$A$ small bar magnet is moved through a coil at a constant speed from one end to the other. Which of the following series of observations will be seen on the galvanometer $G$ attached across the coil? Three positions shown describe: $(a)$ the magnet's entry,$(b)$ the magnet is completely inside,and $(c)$ the magnet's exit.
Two identical coaxial circular loops carry a current $i$ each,circulating in the same direction. If the loops approach each other,then:
Vedclass Products
For Students
Vedclass Test Series
Mock tests in real JEE/NEET style with performance analysis. 5-day free trial.
Start Free TrialFor Teachers
Exam Paper Generator
Generate Set A/B/C/D exam papers from 7.5L+ questions in 2 minutes. 3 chapters free.
Try FreeFor Institutes
Online Exam Module
Live online exams with unlimited students, 360° analytics & white-label branding.
See Demo