
The figure shown has two coils of wires placed in close proximity. The current in primary coil $P$ is made to vary with time as shown in the graph. Which of the following graphs best represents the variation of the emf induced in the secondary coil $S$?
- A
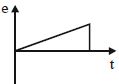
- B
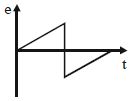
- C
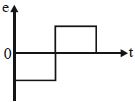
- D
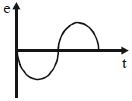
Explore More
Similar Questions
$A$ bar magnet falls from rest under gravity through the centre of a horizontal ring of conducting wire as shown in figure. Which of the following graph best represents the speed $(v)$ vs. time $(t)$ graph of the bar magnet?
MediumWBJEE 2023
View SolutionThe dimension of the ratio of magnetic flux and the resistance is equal to that of:
Medium
View SolutionTwo different coils have inductances $L_1 = 4 \ mH$ and $L_2 = 2 \ mH$. At a certain instant,the current in the two coils is increasing at the same constant rate,and the power supplied to the first coil is four times that of the second coil. If $e$,$I$,and $U$ indicate the potential difference,current,and energy stored in the inductance respectively,then which of the following is correct?
Difficult
View SolutionThe network shown in the figure is part of a complete circuit. If at a certain instant the current $i$ is $5 \, A$ and is decreasing at the rate of $10^3 \, A/s$, then $V_B - V_A$ is: (in $ \, V$)
$A$ square coil $ABCD$ is placed in the $x-y$ plane with its centre at the origin. $A$ long straight wire,passing through the origin,carries a current in the negative $z$-direction. The current in this wire increases with time. The induced current in the coil is:
Medium
View SolutionVedclass Products
For Students
Vedclass Test Series
Mock tests in real JEE/NEET style with performance analysis. 5-day free trial.
Start Free TrialFor Teachers
Exam Paper Generator
Generate Set A/B/C/D exam papers from 7.5L+ questions in 2 minutes. 3 chapters free.
Try FreeFor Institutes
Online Exam Module
Live online exams with unlimited students, 360° analytics & white-label branding.
See Demo