
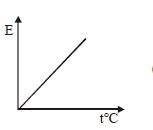
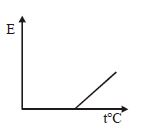
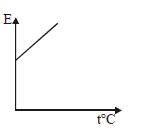
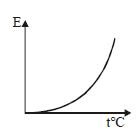
The graph which represents the variation of mean kinetic energy of molecules with temperature $t^{\circ} \text{C}$ is
- A
- B
- C
- D
Explore More
Similar Questions
$A$ sealed container with negligible coefficient of volumetric expansion contains helium (a monoatomic gas). When it is heated from $300\, K$ to $600\, K,$ the average kinetic energy $(K.E.)$ of helium atoms is
Easy
View SolutionAt what temperature in $^\circ C$ will the kinetic energy of gas molecules be double the kinetic energy at $27^\circ C$?
Medium
View SolutionThe ratio of the mean kinetic energy of hydrogen and oxygen at a given temperature is
Easy
View SolutionAt what temperature does the average translational kinetic energy of a molecule in a gas become equal to the kinetic energy of an electron accelerated from rest through a potential difference of $V$ volt? ($N=$ Avogadro number,$R=$ gas constant,$e=$ electronic charge)
The energy of a gas per litre is $600 \text{ J}$. What will be its pressure?
DifficultMHT CET 2026
View SolutionVedclass Products
For Students
Vedclass Test Series
Mock tests in real JEE/NEET style with performance analysis. 5-day free trial.
Start Free TrialFor Teachers
Exam Paper Generator
Generate Set A/B/C/D exam papers from 7.5L+ questions in 2 minutes. 3 chapters free.
Try FreeFor Institutes
Online Exam Module
Live online exams with unlimited students, 360° analytics & white-label branding.
See Demo