
The magnetic flux $\phi$ through a coil varies with time $t$ as shown in the diagram. Which graph best represents the variation of the induced electromotive force (e.m.f.) $E$ in the coil with time $t$?
- A
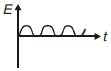
- B
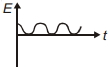
- C
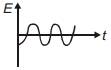
- D
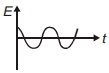
Explore More
Similar Questions
$A$ bar magnet falls with its north pole pointing down through the axis of a copper ring. When viewed from above,the current in the ring will be
MediumKVPY 2014
View SolutionThe magnetic flux through a coil of resistance $R$ changes by an amount $\Delta \phi$ in time $\Delta t$. The amount of induced current and induced charge in the coil are respectively:
Magnetic flux linked with the coil in weber is given by the equation $\phi = 5t^2 + 6t + 11$. The e.m.f. induced in the coil in the $5^{\text{th}}$ second will be (in $\text{ V}$)
DifficultMHT CET 2026
View SolutionThe law of electromagnetic induction has been used in the construction of
$A$ long solenoid has $20$ turns per cm. $A$ small loop of area $\frac{4}{\pi} \text{ cm}^2$ is placed inside the solenoid normal to its axis. If the current carried by the solenoid changes steadily from $1.0 \text{ A}$ to $3.0 \text{ A}$ in $0.2 \text{ s}$,what is the magnitude of the induced emf in the loop while the current is changing (in $\mu \text{V}$)?
Vedclass Products
For Students
Vedclass Test Series
Mock tests in real JEE/NEET style with performance analysis. 5-day free trial.
Start Free TrialFor Teachers
Exam Paper Generator
Generate Set A/B/C/D exam papers from 7.5L+ questions in 2 minutes. 3 chapters free.
Try FreeFor Institutes
Online Exam Module
Live online exams with unlimited students, 360° analytics & white-label branding.
See Demo