
The number of undecayed nuclei $N$ in a sample of radioactive material as a function of time $t$ is shown in the figure. Which of the following graphs correctly shows the relationship between $N$ and the activity $A$?
- A
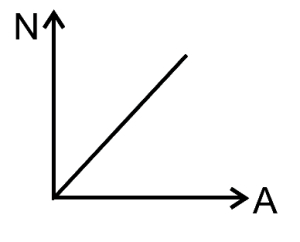
- B
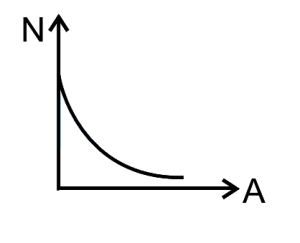
- C
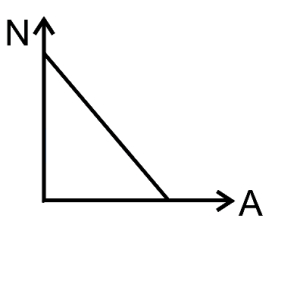
- D
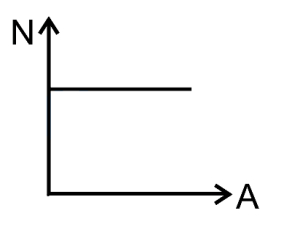
Explore More
Similar Questions
$A$ radioactive substance has a half-life of $60\, minutes$. After $3\, hours$,the fraction of atoms that have decayed would be ......... $\%$
Medium
View Solution$A$ neutron beam has a kinetic energy of $0.0837 \, eV$. Its half-life is $693 \, s$ and its mass is $1.675 \times 10^{-27} \, kg$. What fraction of the neutrons will remain undecayed after traveling a distance of $40 \, m$?
Difficult
View Solution$A$ sample of radioactive material has mass $m$,decay constant $\lambda$,and molar mass $M$. If the Avogadro constant is $N_A$,what is the initial activity of the sample?
Medium
View SolutionThe half-life of a radioactive substance is $20 \, \text{minutes}$. The approximate time interval $(t_2 - t_1)$ between the time $t_2$ when $\frac{3}{4}$ of it has decayed and time $t_1$ when $\frac{1}{4}$ of it has decayed is:
Difficult
View SolutionHalf-life of a radioactive element is $10 \, days$. The time during which the quantity remains $1/10$ of the initial mass will be ......... $days$.
Easy
View SolutionVedclass Products
For Students
Vedclass Test Series
Mock tests in real JEE/NEET style with performance analysis. 5-day free trial.
Start Free TrialFor Teachers
Exam Paper Generator
Generate Set A/B/C/D exam papers from 7.5L+ questions in 2 minutes. 3 chapters free.
Try FreeFor Institutes
Online Exam Module
Live online exams with unlimited students, 360° analytics & white-label branding.
See Demo