
Two different metals are joined end to end. One end is kept at a constant temperature and the other end is heated to a very high temperature. The graph depicting the thermo $e.m.f.$ $(E)$ versus temperature $(t)$ is:
- A
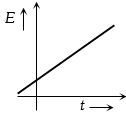
- B
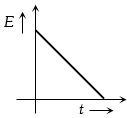
- C
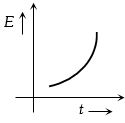
- D
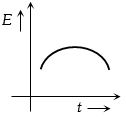
Explore More
Similar Questions
Two cells $A$ and $B$ of emf $2 \text{ V}$ and $1.5 \text{ V}$ respectively, are connected as shown in the figure through an external resistance $10 \text{ } \Omega$. The internal resistance of each cell is $5 \text{ } \Omega$. The potential difference $V_{A}$ and $V_{B}$ across the terminals of the cells $A$ and $B$ respectively are:
MediumWBJEE 2015
View SolutionThe two ends of a conductor are connected to a cell having an $e.m.f. \ E$ and some internal resistance. Starting from the midpoint $P$ of the conductor,moving in the direction of the current,and returning to point $P$,which of the following graphs best represents the potential $V$ versus the distance $x$ covered along the path?
Medium
View SolutionWhen a current of $1\, A$ is passed through a conductor whose ends are maintained at a temperature difference of $1\, ^oC$,the amount of heat evolved or absorbed is called:
Medium
View Solution$A$ certain amount of charge produces $0.8 \, g$ of $O_2$. How many grams of silver will the same amount of charge produce?
Difficult
View SolutionThe value of the resistance $R$ in the figure is adjusted such that the power dissipated in the $2\,\Omega$ resistor is maximum. Under this condition:
Difficult
View SolutionVedclass Products
For Students
Vedclass Test Series
Mock tests in real JEE/NEET style with performance analysis. 5-day free trial.
Start Free TrialFor Teachers
Exam Paper Generator
Generate Set A/B/C/D exam papers from 7.5L+ questions in 2 minutes. 3 chapters free.
Try FreeFor Institutes
Online Exam Module
Live online exams with unlimited students, 360° analytics & white-label branding.
See Demo