
Which graph correctly correlates $E_{cell}$ as a function of concentrations for the cell (for different values of $M$ and $M'$):-
$Zn_{(s)} + Cu^{2+}(M) \to Zn^{2+}(M') + Cu_{(s)};$ $E^o_{cell} = 1.10 \, V$
$X$-axis : $log_{10} \frac{[Zn^{2+}]}{[Cu^{2+}]}$,$Y$-axis : $E_{cell}$
$Zn_{(s)} + Cu^{2+}(M) \to Zn^{2+}(M') + Cu_{(s)};$ $E^o_{cell} = 1.10 \, V$
$X$-axis : $log_{10} \frac{[Zn^{2+}]}{[Cu^{2+}]}$,$Y$-axis : $E_{cell}$
- A
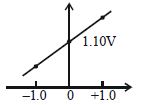
- B
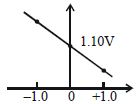
- C
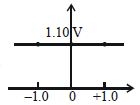
- D
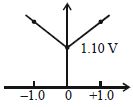
Explore More
Similar Questions
In a cell reaction,a $2$ electron change occurs. The standard $e.m.f.$ of the cell at $25^\circ C$ is $0.295 \ V$. What is the equilibrium constant for the reaction at $25^\circ C$?
Easy
View SolutionThe reduction potential of a hydrogen half-cell will be negative if:
$Cu^{2+} + 2e^- \to Cu$. On increasing $[Cu^{2+}]$ concentration,electrode potential
Medium
View SolutionThe correct representation of Nernst's equation for the reduction of a metal ion $M^{n+}$ to metal $M$ is:
Easy
View SolutionVedclass Products
For Students
Vedclass Test Series
Mock tests in real JEE/NEET style with performance analysis. 5-day free trial.
Start Free TrialFor Teachers
Exam Paper Generator
Generate Set A/B/C/D exam papers from 7.5L+ questions in 2 minutes. 3 chapters free.
Try FreeFor Institutes
Online Exam Module
Live online exams with unlimited students, 360° analytics & white-label branding.
See Demo