
Class 11Physics1 Thermal Properties of Matter: Thermometry, Expansion and CalorimetryMix Examples-Thermometry, Thermal Expansion and Calorimetry
DifficultWhich of the following best represents the temperature versus heat supplied graph for water, in the range of $-20^{\circ}C$ to $120^{\circ}C$?
- A
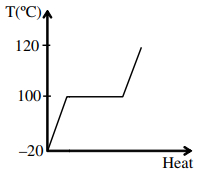
- B
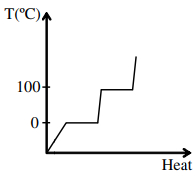
- C
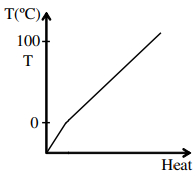
- D
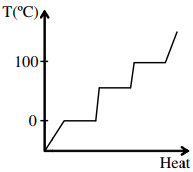
Explore More
Similar Questions
Why is cooking faster in a pressure cooker?
Easy
View Solution$ 1 \text{ g} $ of ice is mixed with $ 1 \text{ g} $ of steam. At thermal equilibrium,the temperature of the mixture is (in $^{\circ} C$)
MediumKCET 2015
View Solution$A$ piece of ice (heat capacity = $2100 \text{ J kg}^{-1} \text{ }^\circ\text{C}^{-1}$ and latent heat = $3.36 \times 10^5 \ J kg^{-1}$) of mass $m$ grams is at $-5^oC$ at atmospheric pressure. It is given $420 \ J$ of heat so that the ice starts melting. Finally, when the ice-water mixture is in equilibrium, it is found that $1 \ gm$ of ice has melted. Assuming there is no other heat exchange in the process, the value of $m$ is ...... $gm$.
Medium
View SolutionIt is possible for a substance to coexist in all three phases in equilibrium,when the substance is at
Easy
View SolutionThe thermo $e.m.f.$ produced in a thermocouple is given by the equation $E = 40\theta - \frac{\theta^2}{20}$,where $\theta$ is the temperature difference between the two junctions. The neutral temperature is ............. $^oC$.
Difficult
View SolutionVedclass Products
For Students
Vedclass Test Series
Mock tests in real JEE/NEET style with performance analysis. 5-day free trial.
Start Free TrialFor Teachers
Exam Paper Generator
Generate Set A/B/C/D exam papers from 7.5L+ questions in 2 minutes. 3 chapters free.
Try FreeFor Institutes
Online Exam Module
Live online exams with unlimited students, 360° analytics & white-label branding.
See Demo