
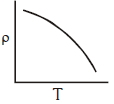
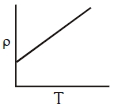
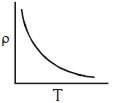
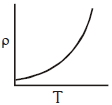
Which of the following graphs represents the variation of resistivity ( $\rho$ ) with temperature $(T)$ for copper?
- A
- B
- C
- D
Explore More
Similar Questions
Equal potentials are applied on an iron and copper wire of the same length. In order to have the same current flow in the two wires, the ratio $r_{\text{iron}} / r_{\text{copper}}$ of their radii must be (Given that specific resistance of iron = $1.0 \times 10^{-7} \, \Omega \cdot \text{m}$ and specific resistance of copper = $1.7 \times 10^{-8} \, \Omega \cdot \text{m}$)
Easy
View Solution$A$ tapered bar of length $L$ and end diameters $D_1$ and $D_2$ is made of a material of electrical resistivity $\rho$. The electrical resistance of the bar is
If copper and silicon are cooled from $300 \, K$ to $60 \, K$,their resistivity will:
Medium
View SolutionWhich of the following has a negative temperature coefficient?
Easy
View SolutionThe specific resistance (resistivity) of manganin is $50 \times 10^{-8} \, \Omega \cdot m$. The resistance of a cube of length $50 \, cm$ will be:
Easy
View SolutionVedclass Products
For Students
Vedclass Test Series
Mock tests in real JEE/NEET style with performance analysis. 5-day free trial.
Start Free TrialFor Teachers
Exam Paper Generator
Generate Set A/B/C/D exam papers from 7.5L+ questions in 2 minutes. 3 chapters free.
Try FreeFor Institutes
Online Exam Module
Live online exams with unlimited students, 360° analytics & white-label branding.
See Demo