
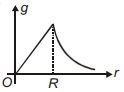
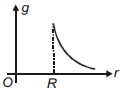
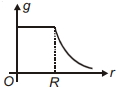
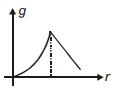
Which of the following graphs represents the variation of acceleration due to gravity $(g)$ with distance $r$ from the centre of the Earth?
- A
- B
- C
- D
Explore More
Similar Questions
As we go from the equator to the poles,the value of $g$
Easy
View SolutionGiven below are two statements: one is labelled as Assertion $A$ and the other is labelled as Reason $R$.
Assertion $A:$ $A$ pendulum clock when taken to Mount Everest becomes fast.
Reason $R:$ The value of $g$ (acceleration due to gravity) is less at Mount Everest than its value on the surface of earth.
In the light of the above statements,choose the most appropriate answer from the options given below.
What is the depth at which the value of acceleration due to gravity becomes $\frac{1}{n}$ times the value at the surface of the Earth? (radius of Earth $= R$)
MediumNEET 2020
View SolutionTwo bodies each of mass $m$ are hung from a balance whose scale pans differ in a vertical height by $h$. If the mean density of the earth is $\rho$,the error in weighing is
The percentage decrease in the weight of a body when taken to a height of $48 \text{ km}$ above the surface of the earth is (Radius of the earth is $6400 \text{ km}$) (in $\%$)
DifficultMHT CET 2026
View SolutionVedclass Products
For Students
Vedclass Test Series
Mock tests in real JEE/NEET style with performance analysis. 5-day free trial.
Start Free TrialFor Teachers
Exam Paper Generator
Generate Set A/B/C/D exam papers from 7.5L+ questions in 2 minutes. 3 chapters free.
Try FreeFor Institutes
Online Exam Module
Live online exams with unlimited students, 360° analytics & white-label branding.
See Demo