
Which of the following graphs correctly represents the plots of $K_{H}$ for gases in water versus temperature?
- A
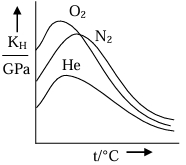
- B
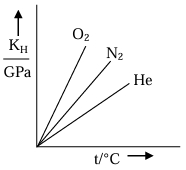
- C
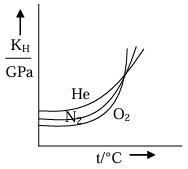
- D
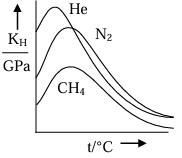
Explore More
Similar Questions
At $293 \ K$,methane gas was passed into $1 \ L$ of water. The partial pressure of methane is $1 \ bar$. The number of moles of methane dissolved in $1 \ L$ water is ($K_{H}$ of methane $= 0.4 \ kbar$)
Calculate the solubility of a gas in water at $0.8 \ atm$ and $25^{\circ} C$. [Henry's law constant is $6.85 \times 10^{-4} \ mol \ dm^{-3} \ atm^{-1}$]
State Henry's law and explain it. Also,mention its applications.
Which of the following gases is least soluble in water at the same temperature and pressure?
Given below are two statements:
Statement $I$: The Henry's law constant $K_{H}$ is constant with respect to variations in solution's concentration over the range for which the solution is ideally dilute.
Statement $II$: $K_{H}$ does not differ for the same solute in different solvents.
In the light of the above statements, choose the correct answer from the options.
DifficultJEE MAIN 2026
View SolutionVedclass Products
For Students
Vedclass Test Series
Mock tests in real JEE/NEET style with performance analysis. 5-day free trial.
Start Free TrialFor Teachers
Exam Paper Generator
Generate Set A/B/C/D exam papers from 7.5L+ questions in 2 minutes. 3 chapters free.
Try FreeFor Institutes
Online Exam Module
Live online exams with unlimited students, 360° analytics & white-label branding.
See Demo