
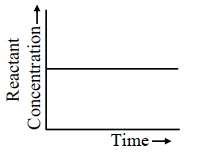
Which of the following graphs most appropriately represents a zero order reaction?
- A
- B
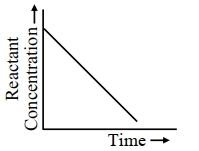
- C
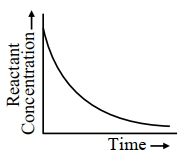
- D
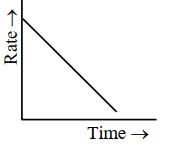
Explore More
Similar Questions
If doubling the initial concentration of reactant doubles $t_{1/2}$ of reaction,the order of reaction is
Medium
View SolutionFor a reaction,$A \rightarrow B$,the rate equation is $r = K[A]^0$. If the initial concentration of the reactant is $a \ mol \ dm^{-3}$,find the half-life time of the reaction.
If the initial concentration is reduced to its $1/4^{th}$ in a zero order reaction,the time taken for half of the reaction to complete
Medium
View SolutionWhat is the value of the slope of a graph obtained by plotting the concentration of reactant $[A]_t$ versus time for a zero order reaction?
Which of the following is correct with respect to the graph given?
$\begin{aligned} & [R]=\text{Concentration at time } t \\ & [R]_0=\text{Initial concentration} \end{aligned}$
$\begin{aligned} & [R]=\text{Concentration at time } t \\ & [R]_0=\text{Initial concentration} \end{aligned}$
Vedclass Products
For Students
Vedclass Test Series
Mock tests in real JEE/NEET style with performance analysis. 5-day free trial.
Start Free TrialFor Teachers
Exam Paper Generator
Generate Set A/B/C/D exam papers from 7.5L+ questions in 2 minutes. 3 chapters free.
Try FreeFor Institutes
Online Exam Module
Live online exams with unlimited students, 360° analytics & white-label branding.
See Demo