
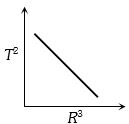
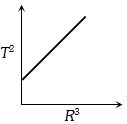
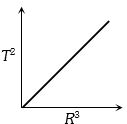
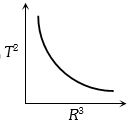
Which of the following graphs represents the motion of a planet moving about the sun?
- A
- B
- C
- D
Explore More
Similar Questions
The time period of a geostationary satellite is $24 \; h$,at a height $6 R_{E}$ ($R_{E}$ is the radius of the Earth) from the surface of the Earth. The time period of another satellite whose height is $2.5 R_{E}$ from the surface will be:
MediumNEET 2019
View SolutionThe figure shows the motion of a planet around the sun in an elliptical orbit with the sun at the focus. The shaded areas are equal. If $t_1$ and $t_2$ represent the time taken for the planet to move from $A$ to $B$ and $C$ to $D$ respectively,then:
Medium
View SolutionThe figure shows the motion of a planet around the sun in an elliptical orbit with the sun at the focus. The shaded areas $A$ and $B$ are also shown in the figure,which can be assumed to be equal. If ${t_1}$ and ${t_2}$ represent the time taken for the planet to move from $a$ to $b$ and $d$ to $c$ respectively,then:
Easy
View SolutionThe motion of satellites in the solar system is an example of which of the following?
Medium
View Solution$A$ planet of mass $m$ is moving in an elliptical orbit about the sun with time period $T$. If $A$ is the area of the orbit,then its angular momentum is:
Medium
View SolutionVedclass Products
For Students
Vedclass Test Series
Mock tests in real JEE/NEET style with performance analysis. 5-day free trial.
Start Free TrialFor Teachers
Exam Paper Generator
Generate Set A/B/C/D exam papers from 7.5L+ questions in 2 minutes. 3 chapters free.
Try FreeFor Institutes
Online Exam Module
Live online exams with unlimited students, 360° analytics & white-label branding.
See Demo