
Which of the following graphs represents the variation of inductive reactance $(X_{L})$ with the frequency of the voltage source $(\nu)$?
- A
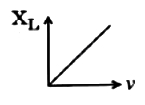
- B
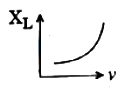
- C
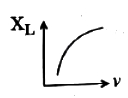
- D
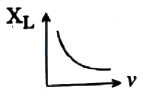
Explore More
Similar Questions
In an a.c. circuit with pure capacitance $C$ and a.c. source $E=E_0 \sin \omega t$,the equation of instantaneous current is given by
Assertion : No power loss is associated with a pure capacitor in an $AC$ circuit.
Reason : No current is flowing in this circuit.
Reason : No current is flowing in this circuit.
MediumAIIMS 2007
View SolutionConsider a pure inductive $A$.$C$. circuit as shown in the figure. If the average power consumed is $P$, then
An alternating voltage given as $V = 100 \sqrt{2} \sin(100t) \text{ V}$ is applied to a capacitor of $1 \mu\text{F}$. The current reading of the ammeter will be equal to . . . . . . $\text{mA}$.
$A$ capacitor '$C$' is connected across a $DC$ source,the reactance of the capacitance will be . . . . . . .
Vedclass Products
For Students
Vedclass Test Series
Mock tests in real JEE/NEET style with performance analysis. 5-day free trial.
Start Free TrialFor Teachers
Exam Paper Generator
Generate Set A/B/C/D exam papers from 7.5L+ questions in 2 minutes. 3 chapters free.
Try FreeFor Institutes
Online Exam Module
Live online exams with unlimited students, 360° analytics & white-label branding.
See Demo