
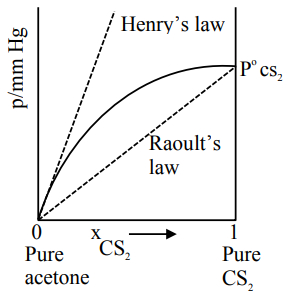
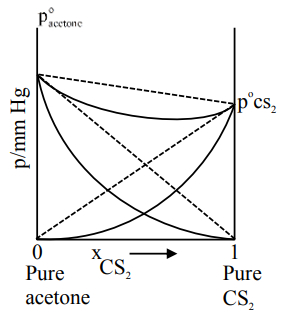
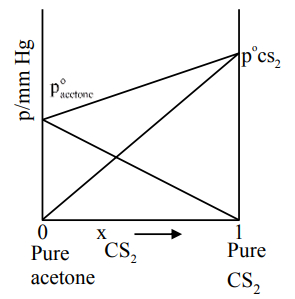
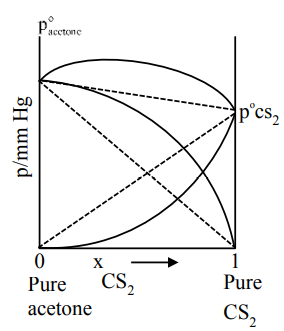
Which one of the following graphs accurately represents the plot of partial pressure of $CS_{2}$ vs its mole fraction in a mixture of acetone and $CS_{2}$ at constant temperature?
- A
- B
- C
- D
Explore More
Similar Questions
Which of the following solutions behaves nearly as an ideal solution?
Each pair forms an ideal solution except?
Medium
View SolutionRaoult's law is obeyed by each constituent of a binary liquid solution when
Easy
View SolutionAssuming ideal behaviour,the enthalpy and volume of mixing of two liquids respectively,are
MediumKVPY 2011
View SolutionWhich one of the following non-ideal solutions shows negative deviation?
Medium
View SolutionVedclass Products
For Students
Vedclass Test Series
Mock tests in real JEE/NEET style with performance analysis. 5-day free trial.
Start Free TrialFor Teachers
Exam Paper Generator
Generate Set A/B/C/D exam papers from 7.5L+ questions in 2 minutes. 3 chapters free.
Try FreeFor Institutes
Online Exam Module
Live online exams with unlimited students, 360° analytics & white-label branding.
See Demo