
Which one of the following represents the graph between $\log p$ (on $Y$-axis) and $\frac{1}{T}$ (on $X$-axis)?
($p=$ vapour pressure of a liquid,$T=$ absolute temperature)
($p=$ vapour pressure of a liquid,$T=$ absolute temperature)
- A
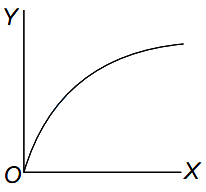
- B
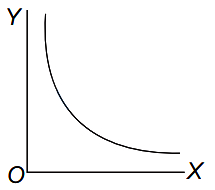
- C
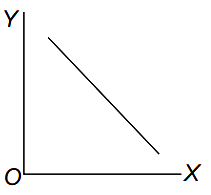
- D
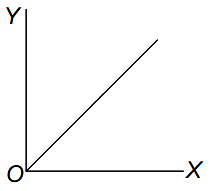
Explore More
Similar Questions
The magnet of a vibration magnetometer is heated so as to reduce its magnetic moment by $19\%$. By doing this,the periodic time of the magnetometer will
The branch of botany that deals with the study of plants providing food,fibers,and wood is known as:
Boric acid is $NOT$ used in which of the following?
Match List-$I$ with List-$II$ for the composition of substances and select the correct answer using the code given below the lists.
List-$I$ (Substances) List-$II$ (Composition) $A$. Plaster of Paris $i$. $CaSO_4 \cdot 1/2H_2O$ $B$. Epsomite $ii$. $MgSO_4 \cdot 7H_2O$ $C$. Kieserite $iii$. $MgSO_4 \cdot H_2O$ $D$. Gypsum $iv$. $CaSO_4 \cdot 2H_2O$ $v$. $CaSO_4$
| List-$I$ (Substances) | List-$II$ (Composition) |
|---|---|
| $A$. Plaster of Paris | $i$. $CaSO_4 \cdot 1/2H_2O$ |
| $B$. Epsomite | $ii$. $MgSO_4 \cdot 7H_2O$ |
| $C$. Kieserite | $iii$. $MgSO_4 \cdot H_2O$ |
| $D$. Gypsum | $iv$. $CaSO_4 \cdot 2H_2O$ |
| $v$. $CaSO_4$ |
If $\frac{ax - 1}{(1 - x + x^2)(2 + x)} = \frac{x}{1 - x + x^2} - \frac{1}{2 + x}$,then $a = $
Vedclass Products
For Students
Vedclass Test Series
Mock tests in real JEE/NEET style with performance analysis. 5-day free trial.
Start Free TrialFor Teachers
Exam Paper Generator
Generate Set A/B/C/D exam papers from 7.5L+ questions in 2 minutes. 3 chapters free.
Try FreeFor Institutes
Online Exam Module
Live online exams with unlimited students, 360° analytics & white-label branding.
See Demo