
Which one of the following schematic graphs best represents the variation of $p V$ (in Joules) versus $T$ (in Kelvin) of one mole of an ideal gas? (The dotted line represents $p V=T$)
- A
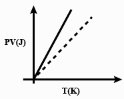
- B
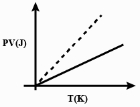
- C
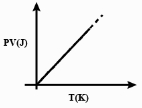
- D
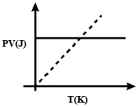
Explore More
Similar Questions
$A$ molecule in a gas container hits a horizontal wall with speed $200 \; m s^{-1}$ at an angle of $30^{\circ}$ with the normal,and rebounds with the same speed. Is momentum conserved in the collision? Is the collision elastic or inelastic?
Medium
View SolutionWhen the temperature of an ideal gas is increased by $600 \ K$,the velocity of sound in the gas becomes $\sqrt{3}$ times the initial velocity in it. The initial temperature of the gas is .... $^oC$
Easy
View SolutionThe r.m.s. velocity of hydrogen at $S.T.P.$ is $u \ m/s$. If the gas is heated at constant pressure until its volume becomes three times,then the final temperature of the gas and the r.m.s. speed are respectively:
At which temperature will the speed of sound in hydrogen be the same as the speed of sound in oxygen at $100\,^{\circ}C$?
Medium
View SolutionStatement $(I)$: Gas thermometers are less sensitive than liquid thermometers.
Statement $(II)$: The ratio of the universal gas constant and Avogadro's number is called Boltzmann's constant.
Statement $(III)$: The density of a given mass of a gas at constant pressure is inversely proportional to its absolute temperature.
The correct option among the following is:
Statement $(II)$: The ratio of the universal gas constant and Avogadro's number is called Boltzmann's constant.
Statement $(III)$: The density of a given mass of a gas at constant pressure is inversely proportional to its absolute temperature.
The correct option among the following is:
Vedclass Products
For Students
Vedclass Test Series
Mock tests in real JEE/NEET style with performance analysis. 5-day free trial.
Start Free TrialFor Teachers
Exam Paper Generator
Generate Set A/B/C/D exam papers from 7.5L+ questions in 2 minutes. 3 chapters free.
Try FreeFor Institutes
Online Exam Module
Live online exams with unlimited students, 360° analytics & white-label branding.
See Demo