
Medium
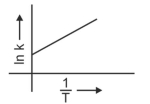
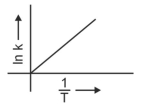
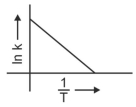
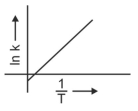
Which plot of $\ln k$ vs $\frac{1}{T}$ is consistent with the Arrhenius equation?
- A
- B
- C
- D
Explore More
Similar Questions
Consider the following graph of the kinetic energy distribution among molecules at temperature $T.$ If the temperature is increased,how would the resulting graph differ from the one above $:-$
Medium
View SolutionFor an endothermic reaction,the energy of activation is $E_a$ and the enthalpy of reaction is $\Delta H$ (both in $kJ/mol$). The minimum value of $E_a$ will be:
MediumAIPMT 2010
View SolutionThe activation energy of a reaction at a given temperature is found to be $2.303 \ RT \ J \ mol^{-1}$. The ratio of rate constant to the Arrhenius factor is
$A$ reaction takes place in three steps with individual rate constant and activation energy as follows: $Step$ $Rate \ constant$ $Activation \ energy$ $Step-1$ $k_1$ $E_{a1} = 180 \ kJ/mol$ $Step-2$ $k_2$ $E_{a2} = 80 \ kJ/mol$ $Step-3$ $k_3$ $E_{a3} = 50 \ kJ/mol$
If overall rate constant,$k = (\frac{k_1 k_2}{k_3})^{2/3}$,then overall activation energy of the reaction will be .......... $kJ/mol$.
| $Step$ | $Rate \ constant$ | $Activation \ energy$ |
| $Step-1$ | $k_1$ | $E_{a1} = 180 \ kJ/mol$ |
| $Step-2$ | $k_2$ | $E_{a2} = 80 \ kJ/mol$ |
| $Step-3$ | $k_3$ | $E_{a3} = 50 \ kJ/mol$ |
Difficult
View SolutionThe rate constant of a reaction depends on ................
Easy
View SolutionVedclass Products
For Students
Vedclass Test Series
Mock tests in real JEE/NEET style with performance analysis. 5-day free trial.
Start Free TrialFor Teachers
Exam Paper Generator
Generate Set A/B/C/D exam papers from 7.5L+ questions in 2 minutes. 3 chapters free.
Try FreeFor Institutes
Online Exam Module
Live online exams with unlimited students, 360° analytics & white-label branding.
See Demo