
For a thin spherical shell of radius $R$ with a uniform surface charge density, which of the following graphs best represents the variation of the electric field magnitude $|\vec{E}(r)|$ and the electric potential $V(r)$ with the distance $r$ from the center?
- A
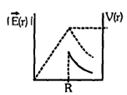
- B
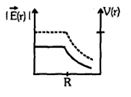
- C
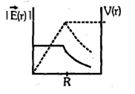
- D
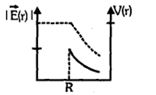
Explore More
Similar Questions
Two identical metallic spheres $A$ and $B$ when placed at a certain distance in air repel each other with a force of $F$. Another identical uncharged sphere $C$ is first placed in contact with $A$ and then in contact with $B$ and finally placed at the midpoint between spheres $A$ and $B$. The force experienced by sphere $C$ will be:
Two identical positive charges are fixed on the $y$-axis, at equal distances from the origin $O$. $A$ particle with a negative charge starts on the $x$-axis at a large distance from $O$, moves along the $+x$-axis, passes through $O$, and moves far away from $O$. Its acceleration $a$ is taken as positive in the positive $x$-direction. The particle's acceleration $a$ is plotted against its $x$-coordinate. Which of the following best represents the plot?
Difficult
View SolutionFor the given figure,the direction of the electric field at point $A$ will be .........
Easy
View Solution$A$ negative point charge is placed at point $A$ as shown in the figure. The charge is:
Difficult
View Solution$F_g$ and $F_e$ represent the gravitational and electrostatic forces,respectively,between two electrons situated at a distance of $10 \ cm$. The ratio of $F_g/F_e$ is of the order of:
Medium
View SolutionVedclass Products
For Students
Vedclass Test Series
Mock tests in real JEE/NEET style with performance analysis. 5-day free trial.
Start Free TrialFor Teachers
Exam Paper Generator
Generate Set A/B/C/D exam papers from 7.5L+ questions in 2 minutes. 3 chapters free.
Try FreeFor Institutes
Online Exam Module
Live online exams with unlimited students, 360° analytics & white-label branding.
See Demo