
$A$ ball is thrown vertically upwards. Which of the following plots represents the speed-time graph of the ball during its flight if air resistance is not ignored?
- A
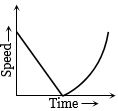
- B
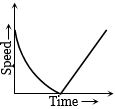
- C
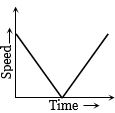
- D
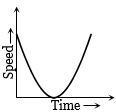
Explore More
Similar Questions
$A$ particle is dropped under gravity from rest from a height $h$ $(g = 9.8 \ m/s^2)$. If it travels a distance of $9h/25$ in the last second of its motion,the height $h$ is ......... $m$.
Difficult
View Solution$A$ ball is released from the top of a tower of height $h$ meters. It takes $T$ seconds to reach the ground. What is the position of the ball in $\frac{T}{3}$ seconds?
DifficultAIEEE 2004
View Solution$A$ balloon was moving upwards with a uniform velocity of $10 \, m/s$. An object of finite mass is dropped from the balloon when it was at a height of $75 \, m$ from the ground level. The height of the balloon from the ground when the object strikes the ground was around (in $m$). (Take the value of $g$ as $10 \, m/s^2$)
DifficultJEE MAIN 2021
View Solution$A$ body falling from a vertical height of $10 \, m$ pierces through a distance of $1 \, m$ in sand. It faces an average retardation in sand equal to (where $g$ = acceleration due to gravity).
Medium
View Solution$A$ ball is thrown vertically upward with an initial velocity of $150\,m/s$. The ratio of velocity after $3\,s$ and $5\,s$ is $\frac{x+1}{x}$. The value of $x$ is $...........$ Take $g=10\,m/s^2$.
Vedclass Products
For Students
Vedclass Test Series
Mock tests in real JEE/NEET style with performance analysis. 5-day free trial.
Start Free TrialFor Teachers
Exam Paper Generator
Generate Set A/B/C/D exam papers from 7.5L+ questions in 2 minutes. 3 chapters free.
Try FreeFor Institutes
Online Exam Module
Live online exams with unlimited students, 360° analytics & white-label branding.
See Demo