
$A$ body performs $S.H.M.$ Its kinetic energy $K$ varies with time $t$ as indicated by which graph?
- A
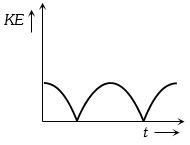
- B
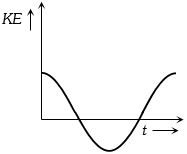
- C
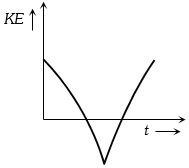
- D
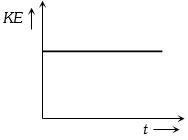
Explore More
Similar Questions
When the potential energy of a particle executing simple harmonic motion is one-fourth of its maximum value during the oscillation,the displacement of the particle from the equilibrium position in terms of its amplitude $a$ is
MediumAIPMT 1993
View SolutionThe displacements of two particles of same mass executing $SHM$ are represented by the equations $x_1=4 \sin \left(10 t+\frac{\pi}{6}\right)$ and $x_2=5 \cos (\omega t)$. The value of $\omega$ for which the energies of both the particles remain same is (in $\text{ unit}$)
The frequency at which kinetic energy changes into potential energy in a simple harmonic motion ($S$.$H$.$M$.) with frequency $f$ is:
Medium
View SolutionFor a particle executing $S.H.M.$, the potential energy is $n$ times the kinetic energy when its displacement from mean position is $(\frac{2\sqrt{2}}{3})A$, where $A$ is the amplitude of $S.H.M.$ The value of $n$ is
DifficultMHT CET 2026
View SolutionShow that for a particle in linear $SHM$,the average kinetic energy over a period of oscillation equals the average potential energy over the same period.
Difficult
View SolutionVedclass Products
For Students
Vedclass Test Series
Mock tests in real JEE/NEET style with performance analysis. 5-day free trial.
Start Free TrialFor Teachers
Exam Paper Generator
Generate Set A/B/C/D exam papers from 7.5L+ questions in 2 minutes. 3 chapters free.
Try FreeFor Institutes
Online Exam Module
Live online exams with unlimited students, 360° analytics & white-label branding.
See Demo