
$A$ sample of a radioactive nucleus $A$ disintegrates to another radioactive nucleus $B$,which in turn disintegrates to some other stable nucleus $C$. Plot a graph showing the variation of the number of atoms of nucleus $B$ versus time:
(Assume that at $t=0$,there are no $B$ atoms in the sample)
(Assume that at $t=0$,there are no $B$ atoms in the sample)
- A
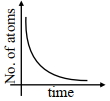
- B
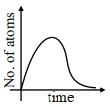
- C
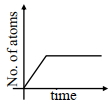
- D
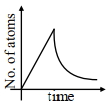
Explore More
Similar Questions
$\beta$-decay means emission of electron from
Radioactivity was discovered by
Easy
View SolutionRadioactive nuclei that are injected into a patient collect at certain sites within their body,undergoing radioactive decay and emitting electromagnetic radiation. These radiations can then be recorded by a detector. This procedure provides an important diagnostic tool called:
Arrange the radioactive radiations in increasing order of their ionizing power and penetrating power.
Easy
View SolutionNeutrino is a particle which $\qquad$
Vedclass Products
For Students
Vedclass Test Series
Mock tests in real JEE/NEET style with performance analysis. 5-day free trial.
Start Free TrialFor Teachers
Exam Paper Generator
Generate Set A/B/C/D exam papers from 7.5L+ questions in 2 minutes. 3 chapters free.
Try FreeFor Institutes
Online Exam Module
Live online exams with unlimited students, 360° analytics & white-label branding.
See Demo