
In the circuits $(a)$ and $(b)$,switches $S_1$ and $S_2$ are closed at $t = 0$ and are kept closed for a long time. The variations of current in the two circuits for $t \ge 0$ are roughly shown by which figure? (Figures are schematic and not drawn to scale.)
- A
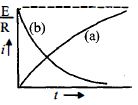
- B
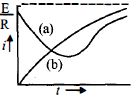
- C
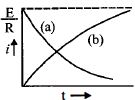
- D
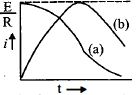
Explore More
Similar Questions
Assertion : The resistance offered by an inductor in a $d.c.$ circuit is always constant.
Reason : The resistance of an inductor in a steady state is non-zero.
Reason : The resistance of an inductor in a steady state is non-zero.
The resistance in the following circuit is increased at a particular instant. At this instant,the value of resistance is $10\,\Omega$. The current in the circuit will be
Difficult
View SolutionIn the given circuit,the sliding contact is pulled outwards such that the electric current in the circuit changes at the rate of $8 \text{ A/s}$. At an instant when $R = 12 \Omega$,the value of the current in the circuit will be . . . . . . $A$.
The current in the $2\, \Omega$ resistance shown in the figure is:
$(a)$ Just after the closing of the key.
$(b)$ $A$ long time after the closing of the key.
$(a)$ Just after the closing of the key.
$(b)$ $A$ long time after the closing of the key.
Medium
View SolutionWhen a certain circuit consisting of an emf $E$,an inductance $L$,and a resistance $R$ is closed,the current in it increases with time according to curve $1$. After one parameter ($L$ or $R$) is changed,the increase in the current follows curve $2$,when the circuit is closed a second time. Which parameter was changed?
Medium
View SolutionVedclass Products
For Students
Vedclass Test Series
Mock tests in real JEE/NEET style with performance analysis. 5-day free trial.
Start Free TrialFor Teachers
Exam Paper Generator
Generate Set A/B/C/D exam papers from 7.5L+ questions in 2 minutes. 3 chapters free.
Try FreeFor Institutes
Online Exam Module
Live online exams with unlimited students, 360° analytics & white-label branding.
See Demo