
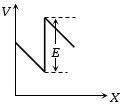
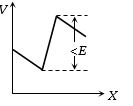
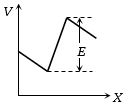
The two ends of a uniform conductor are joined to a cell of $e.m.f.$ $E$ and some internal resistance. Starting from the midpoint $P$ of the conductor,we move in the direction of current and return to $P$. The potential $V$ at every point on the path is plotted against the distance covered $(x)$. Which of the following graphs best represents the resulting curve?
- A
- B
- C
- D
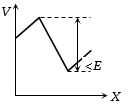
Explore More
Similar Questions
The figure shows a network of four resistances and three batteries. The electrical power dissipated as heat in the circuit is .............. $W$.
Difficult
View SolutionIf the internal resistance of a cell is proportional to the current drawn from the cell,then the best representation of the terminal potential difference of the cell with respect to the current drawn from the cell will be:
Difficult
View SolutionElectroplating does not help in
Medium
View SolutionThe thermo-emf of a hypothetical thermocouple varies with the temperature $\theta$ of the hot junction as $E = a\theta + b\theta^2$ in volts,where the ratio $a/b$ is $700^{\circ}C$. If the cold junction is kept at $0^{\circ}C$,then the neutral temperature is:
DifficultAP EAMCET 2011
View Solution$A$ galvanometer $(G)$ of $2 \ \Omega$ resistance is connected in the given circuit. The ratio of charge in $C_1$ $(4 \ \mu F)$ and $C_2$ $(6 \ \mu F)$ is:
DifficultJEE MAIN 2024
View SolutionVedclass Products
For Students
Vedclass Test Series
Mock tests in real JEE/NEET style with performance analysis. 5-day free trial.
Start Free TrialFor Teachers
Exam Paper Generator
Generate Set A/B/C/D exam papers from 7.5L+ questions in 2 minutes. 3 chapters free.
Try FreeFor Institutes
Online Exam Module
Live online exams with unlimited students, 360° analytics & white-label branding.
See Demo