
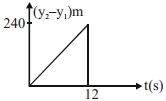
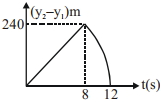
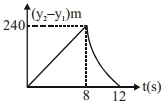
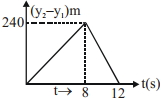
Two stones are thrown up simultaneously from the edge of a cliff $240 \ m$ high with initial speeds of $10 \ m/s$ and $40 \ m/s$ respectively. Which of the following graphs best represents the time variation of the relative position of the second stone with respect to the first? (Assume stones do not rebound after hitting the ground and neglect air resistance,take $g = 10 \ m/s^2$)
- A
- B
- C
- D
Explore More
Similar Questions
$A$ body is projected vertically up with a velocity $v$ and after some time it returns to the point from which it was projected. The average velocity and average speed of the body for the total time of flight are
Medium
View SolutionIf a car covers $2/5^{th}$ of the total distance with speed $v_1$ and $3/5^{th}$ of the total distance with speed $v_2$,then the average speed is:
Medium
View SolutionFor the velocity-time graph shown in the figure, in a time interval from $t=0$ to $t=6\,s$, match the following columns.
Column $I$ Column $II$ $(A)$ Change in velocity $(p)$ $-5/3\,SI \text{ unit}$ $(B)$ Average acceleration $(q)$ $-20\,SI \text{ unit}$ $(C)$ Total displacement $(r)$ $-10\,SI \text{ unit}$ $(D)$ Acceleration at $t=3\,s$ $(s)$ $-5\,SI \text{ unit}$
| Column $I$ | Column $II$ |
|---|---|
| $(A)$ Change in velocity | $(p)$ $-5/3\,SI \text{ unit}$ |
| $(B)$ Average acceleration | $(q)$ $-20\,SI \text{ unit}$ |
| $(C)$ Total displacement | $(r)$ $-10\,SI \text{ unit}$ |
| $(D)$ Acceleration at $t=3\,s$ | $(s)$ $-5\,SI \text{ unit}$ |
All the graphs below are intended to represent the same motion. One of them does it incorrectly. Pick it up.
The $v-t$ graph of an object of mass $1\,\text{kg}$ is shown. Which of the following statements is correct?
Medium
View SolutionVedclass Products
For Students
Vedclass Test Series
Mock tests in real JEE/NEET style with performance analysis. 5-day free trial.
Start Free TrialFor Teachers
Exam Paper Generator
Generate Set A/B/C/D exam papers from 7.5L+ questions in 2 minutes. 3 chapters free.
Try FreeFor Institutes
Online Exam Module
Live online exams with unlimited students, 360° analytics & white-label branding.
See Demo