
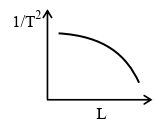
Using a simple pendulum experiment, $g$ is determined by measuring its time period $T$. Which of the following plots represents the correct relation between the pendulum length $L$ and time period $T$?
- A
- B
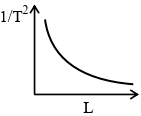
- C
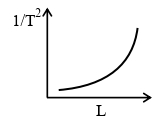
- D
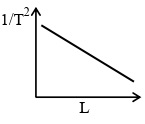
Explore More
Similar Questions
Two simple pendulums are given: the first has a bob of mass $M_1$ and length $L_1$,and the second has a bob of mass $M_2$ and length $L_2$. Given $M_1 = M_2$ and $L_1 = 2L_2$. If the vibrational energy of both is the same,which of the following statements is correct?
Medium
View SolutionThe amplitude of an oscillating simple pendulum is $10 \ cm$ and its period is $4 \ s$. Its speed $1 \ s$ after it passes its equilibrium position is ... $m/s$.
Easy
View Solution$A$ cuboidal piece of wood has dimensions $a, b$ and $c$. Its relative density is $d$. It is floating in a large body of water such that side $a$ is vertical. It is pushed down a bit and released. The time period of $SHM$ executed by it is:
Difficult
View SolutionTwo pendulums differ in lengths by $22 \ cm$. They oscillate at the same place such that one of them makes $15 \ oscillations$ and the other makes $18 \ oscillations$ during the same time. The lengths (in $cm$) of the pendulums are
Difficult
View SolutionThe period of a simple pendulum is measured as $T$ in a stationary lift. If the lift moves upwards with an acceleration of $5g$,the new period will be:
Easy
View SolutionVedclass Products
For Students
Vedclass Test Series
Mock tests in real JEE/NEET style with performance analysis. 5-day free trial.
Start Free TrialFor Teachers
Exam Paper Generator
Generate Set A/B/C/D exam papers from 7.5L+ questions in 2 minutes. 3 chapters free.
Try FreeFor Institutes
Online Exam Module
Live online exams with unlimited students, 360° analytics & white-label branding.
See Demo