
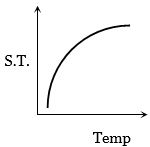
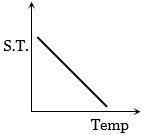
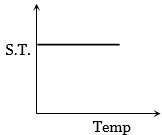
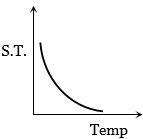
Which graph represents the variation of surface tension with temperature over small temperature ranges for water?
- A
- B
- C
- D
Explore More
Similar Questions
The surface tension of a liquid at its boiling point
Easy
View SolutionWater is filled up to a height $h$ in a beaker of radius $R$ as shown in the figure. The density of water is $\rho$,the surface tension of water is $T$ and the atmospheric pressure is $P_0$. Consider a vertical section $ABCD$ of the water column through a diameter of the beaker. The force on water on one side of this section by water on the other side of this section has magnitude
What mass should be suspended from the wire $CD$ to keep it in equilibrium?
Easy
View Solution$A$ ring is cut from a platinum tube with an internal diameter of $8.5\, cm$ and an external diameter of $8.7\, cm$. It is supported horizontally from the pan of a balance so that it comes in contact with the water in a glass vessel. If an extra $3.97\, g$ weight is required to pull it away from the water,the surface tension of water is ......... $dyne\, cm^{-1}$.
DifficultAIIMS 2013
View Solution$A$ $U$-shaped wire is dipped in a soap solution and removed. The thin soap film formed between the wire and the light slider supports a weight of $1.5 \times 10^{-2} \; N$ (which includes the small weight of the slider). The length of the slider is $30 \; cm$. What is the surface tension of the film?
Medium
View SolutionVedclass Products
For Students
Vedclass Test Series
Mock tests in real JEE/NEET style with performance analysis. 5-day free trial.
Start Free TrialFor Teachers
Exam Paper Generator
Generate Set A/B/C/D exam papers from 7.5L+ questions in 2 minutes. 3 chapters free.
Try FreeFor Institutes
Online Exam Module
Live online exams with unlimited students, 360° analytics & white-label branding.
See Demo