
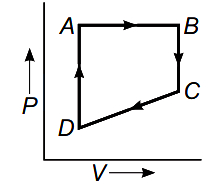
$A$ cyclic process $ABCD$ is shown in the given $P-V$ diagram. Which of the following diagrams represents the same process in a $P-T$ graph?
- A
- B
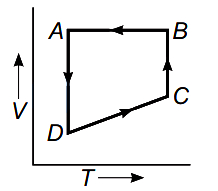
- C
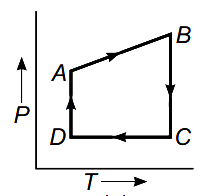
- D
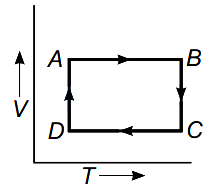
Explore More
Similar Questions
Draw $P-V$ curves for isothermal and adiabatic processes of an ideal gas.
Easy
View SolutionIf a heat engine and a refrigerator are working between the same two temperatures $T_1$ and $T_2$ $(T_1 > T_2)$,then the ratio of the efficiency of the heat engine to the coefficient of performance of the refrigerator is:
$A$ gas is compressed from a volume of $2 \,m^3$ to a volume of $1 \,m^3$ at a constant pressure of $100 \,N m^{-2}$. Then it is heated at constant volume by supplying $150 \,J$ of energy. As a result,the internal energy of the gas
An ideal gas at pressure $P$ and volume $V$ is expanded to volume $2V$. Column $I$ represents the thermodynamic processes used during expansion. Column $II$ represents the work done during these processes in random order:
Column $I$ Column $II$ $(p)$ isobaric $(x)$ $\frac{PV(1 - 2^{1 - \gamma})}{\gamma - 1}$ $(q)$ isothermal $(y)$ $PV$ $(r)$ adiabatic $(z)$ $PV \ln 2$
The correct matching of column $I$ and column $II$ is given by:
| Column $I$ | Column $II$ |
| $(p)$ isobaric | $(x)$ $\frac{PV(1 - 2^{1 - \gamma})}{\gamma - 1}$ |
| $(q)$ isothermal | $(y)$ $PV$ |
| $(r)$ adiabatic | $(z)$ $PV \ln 2$ |
The correct matching of column $I$ and column $II$ is given by:
Difficult
View Solution$A$ cyclic process $ABCA$ is shown in the $V-T$ diagram. The process on the $P-V$ diagram is:
Medium
View SolutionVedclass Products
For Students
Vedclass Test Series
Mock tests in real JEE/NEET style with performance analysis. 5-day free trial.
Start Free TrialFor Teachers
Exam Paper Generator
Generate Set A/B/C/D exam papers from 7.5L+ questions in 2 minutes. 3 chapters free.
Try FreeFor Institutes
Online Exam Module
Live online exams with unlimited students, 360° analytics & white-label branding.
See Demo