
Medium
$A$ graph plotted between $\log \,K$ vs $\frac{1}{T}$ for calculating activation energy is shown by:
- A
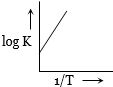
- B
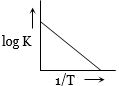
- C
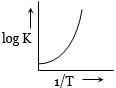
- D
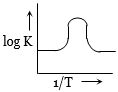
Explore More
Similar Questions
$A$ plot of $ \frac{1}{T} $ vs. $ \ln k $ for a reaction gives the slope $ -1 \times 10^{4} \ K $. The energy of activation for the reaction is (Given $ R = 8.314 \ J \ K^{-1} \ mol^{-1} $)
The reaction between $H_{2(g)}$ and $O_{2(g)}$ is highly feasible,yet allowing the gases to stand at room temperature in the same vessel does not lead to the formation of water. Explain.
Easy
View SolutionFor a first order reaction $A \rightarrow P$,the temperature $(T)$ dependent rate constant $(k)$ was found to follow the equation $\log k = -(2000) \frac{1}{T} + 6.0$. The pre-exponential factor $A$ and the activation energy $E_{a}$,respectively,are
DifficultIIT 2009
View SolutionWhat is the effect of temperature on the rate constant of a reaction? How can this effect of temperature on rate constant be represented quantitatively?
Medium
View SolutionAmong the following,the $INCORRECT$ statement regarding the collision theory of chemical reaction is:
MediumKVPY 2021
View SolutionVedclass Products
For Students
Vedclass Test Series
Mock tests in real JEE/NEET style with performance analysis. 5-day free trial.
Start Free TrialFor Teachers
Exam Paper Generator
Generate Set A/B/C/D exam papers from 7.5L+ questions in 2 minutes. 3 chapters free.
Try FreeFor Institutes
Online Exam Module
Live online exams with unlimited students, 360° analytics & white-label branding.
See Demo