
Consider a thin spherical shell of radius $R$ with its centre at the origin,carrying uniform positive surface charge density. The variation of the magnitude of the electric field $|\vec{E}(r)|$ and the electric potential $V(r)$ with the distance $r$ from the centre,is best represented by which graph?
- A
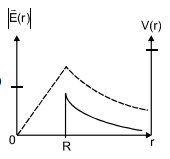
- B
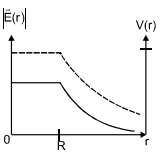
- C
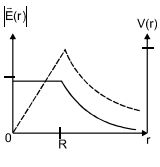
- D
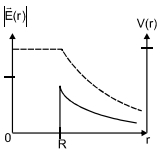
Explore More
Similar Questions
In finding the electric field using Gauss's Law,the formula $|\overrightarrow{E}| = \frac{q_{enc}}{\varepsilon_{0}|A|}$ is applicable. In the formula,$\varepsilon_{0}$ is the permittivity of free space,$A$ is the area of the Gaussian surface,and $q_{enc}$ is the charge enclosed by the Gaussian surface. The equation can be used in which of the following situations?
As shown in the figure,a charged ball $B$ is suspended from a large charged conducting plate by a silk thread $S$ making an angle $\theta$ with the plate. The surface charge density $\sigma$ of the plate is proportional to ........
Difficult
View SolutionThe figure shows the graph of electric field $E(r)$ versus distance $(r)$ from the center of an object. Therefore,...
Easy
View Solution$A$ cube of side $a$ is placed in an electric field $\vec{E} = E_0 x \hat{i}$. What is the total charge enclosed by the cube?
Difficult
View SolutionElectric field inside a uniformly charged sphere of radius $R$ is (where $r$ is the distance from the centre,$r < R$):
Medium
View SolutionVedclass Products
For Students
Vedclass Test Series
Mock tests in real JEE/NEET style with performance analysis. 5-day free trial.
Start Free TrialFor Teachers
Exam Paper Generator
Generate Set A/B/C/D exam papers from 7.5L+ questions in 2 minutes. 3 chapters free.
Try FreeFor Institutes
Online Exam Module
Live online exams with unlimited students, 360° analytics & white-label branding.
See Demo