
$A$ radioactive element decays to form a stable nuclide. The graph representing the number of radioactive nuclei $(N)$ versus time $(t)$ is:
- A
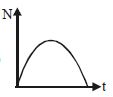
- B
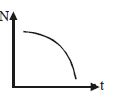
- C
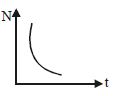
- D
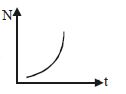
Explore More
Similar Questions
The half-life of a radioactive substance is $20 \ min$. The approximate time interval $(t_{2}-t_{1})$ between the time $t_{2}$,when $2/3$ of it has decayed,and time $t_{1}$,when $1/3$ of it has decayed,is (in $min$):
MediumAIIMS 2018
View SolutionIf the half-life of an element is $69.3 \text{ hours}$,what percentage of it will decay between the $10^{\text{th}}$ and $11^{\text{th}}$ hours? (Initial activity $= 50 \mu Ci$)
DifficultAIIMS 2019
View SolutionDefine the disintegration rate or radioactivity of a sample and obtain the relation $R = \lambda N$ and define its different units.
Medium
View SolutionHalf-lives of two radioactive elements $A$ and $B$ are $20 \ min$ and $40 \ min$,respectively. Initially,the samples have equal number of nuclei. After $80 \ min$,the ratio of decayed number of $A$ and $B$ nuclei will be
$A$ sample has a half-life of $10^{33}$ years. If the initial number of nuclei of the sample is $26 \times 10^{24}$,then the number of nuclei decayed in $1$ year is ........... $\times 10^{-7}$.
MediumAIIMS 2019
View SolutionVedclass Products
For Students
Vedclass Test Series
Mock tests in real JEE/NEET style with performance analysis. 5-day free trial.
Start Free TrialFor Teachers
Exam Paper Generator
Generate Set A/B/C/D exam papers from 7.5L+ questions in 2 minutes. 3 chapters free.
Try FreeFor Institutes
Online Exam Module
Live online exams with unlimited students, 360° analytics & white-label branding.
See Demo