
A English
Graphical Representation of Motion Questions in English
Class 9 Science · MOTION · Graphical Representation of Motion
83+
Questions
English
Language
100%
With Solutions
Showing 50 of 83 questions in English
1
Medium
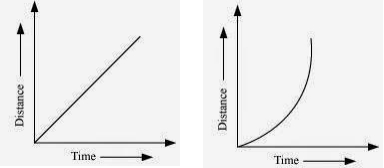
What is the nature of the distance-time graphs for uniform and non-uniform motion of an object?
Solution
(N/A) $1$. For uniform motion: The distance-time graph is a straight line. This indicates that the object covers equal distances in equal intervals of time,meaning the speed is constant.
$2$. For non-uniform motion: The distance-time graph is not a straight line; it is a curve. This indicates that the object covers unequal distances in equal intervals of time,meaning the speed is changing.
$2$. For non-uniform motion: The distance-time graph is not a straight line; it is a curve. This indicates that the object covers unequal distances in equal intervals of time,meaning the speed is changing.
0 likes
View Solution2
Medium
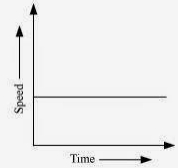
What can you say about the motion of an object if its speed-time graph is a straight line parallel to the time axis?
Solution
(N/A) If the speed-time graph is a straight line parallel to the time axis,it indicates that the speed of the object remains constant over time.
This type of motion is known as uniform motion,where the acceleration of the object is zero.
This type of motion is known as uniform motion,where the acceleration of the object is zero.
1 likes
View Solution3
EasyMCQ
What is the quantity which is measured by the area occupied below the velocity-time graph?
A
Distance
B
Acceleration
C
Velocity
D
Time
Solution
(A) The area under the velocity-time graph represents the displacement or the distance covered by an object moving with a certain velocity over a specific time interval.
0 likes
View Solution4
Difficult
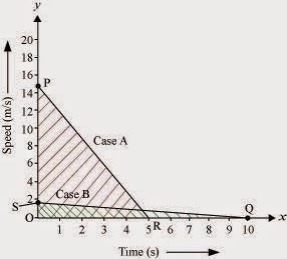
$A$ driver of a car travelling at $52\, km\, h^{-1}$ applies the brakes and accelerates uniformly in the opposite direction. The car stops in $5\, s$. Another driver going at $3\, km\, h^{-1}$ in another car applies his brakes slowly and stops in $10\, s$. On the same graph paper,plot the speed versus time graphs for the two cars. Which of the two cars travelled farther after the brakes were applied?
Solution
(A) First,convert the initial speeds from $km\, h^{-1}$ to $m\, s^{-1}$:
For the first car: $u_1 = 52 \times (1000 / 3600) \, m\, s^{-1} = 14.44 \, m\, s^{-1}$.
For the second car: $u_2 = 3 \times (1000 / 3600) \, m\, s^{-1} = 0.83 \, m\, s^{-1}$.
The distance travelled by a car is equal to the area under the speed-time graph.
Distance travelled by the first car = Area of triangle with base $5\, s$ and height $14.44 \, m\, s^{-1}$.
$= (1 / 2) \times 5 \times 14.44 = 36.1 \, m$.
Distance travelled by the second car = Area of triangle with base $10\, s$ and height $0.83 \, m\, s^{-1}$.
$= (1 / 2) \times 10 \times 0.83 = 4.15 \, m$.
Comparing the two distances,the first car travelled farther after the brakes were applied.
1 likes
View Solution5
Medium
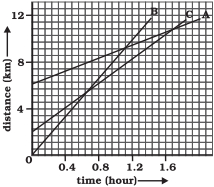
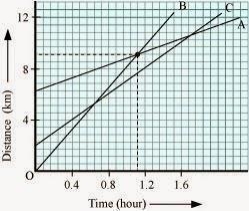
The figure shows the distance-time graph of three objects $A$,$B$,and $C$. Study the graph and answer the following questions:
$(a)$ Which of the three is travelling the fastest?
$(b)$ Are all three ever at the same point on the road?
$(c)$ How far has $C$ travelled when $B$ passes $A$?
$(d)$ How far has $B$ travelled by the time it passes $C$?
$(a)$ Which of the three is travelling the fastest?
$(b)$ Are all three ever at the same point on the road?
$(c)$ How far has $C$ travelled when $B$ passes $A$?
$(d)$ How far has $B$ travelled by the time it passes $C$?
Solution
(B) Object $B$.
$(b)$ No,all three objects $A$,$B$,and $C$ never meet at a single point on the graph.
$(c)$ To find the distance $C$ has travelled when $B$ passes $A$:
$1$. Identify the point where $B$ and $A$ intersect. This occurs at a distance of $9 \, km$ from the origin.
$2$. At this time,look at the position of object $C$ on the graph. Object $C$ is at a distance of approximately $7 \, km$ from the origin.
$3$. Object $C$ started at $2 \, km$ from the origin.
$4$. Therefore,the distance travelled by $C$ is $7 \, km - 2 \, km = 5 \, km$.
$(d)$ To find the distance $B$ has travelled by the time it passes $C$:
$1$. Identify the point where $B$ and $C$ intersect. This occurs at a distance of approximately $9.14 \, km$ from the origin.
$2$. Since object $B$ started from the origin $(0 \, km)$,the distance travelled by $B$ is $9.14 \, km - 0 \, km = 9.14 \, km$.
0 likes
View Solution6
Medium
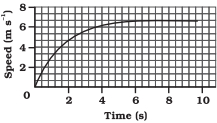
The speed-time graph for a car is shown in the figure.
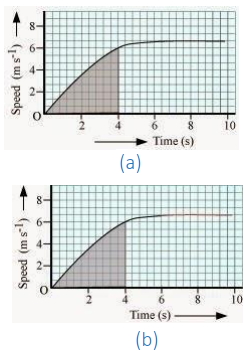
$(a)$ Find how far the car travels in the first $4 \, s$. Shade the area on the graph that represents the distance travelled by the car during this period.
$(b)$ Which part of the graph represents the uniform motion of the car?
$(a)$ Find how far the car travels in the first $4 \, s$. Shade the area on the graph that represents the distance travelled by the car during this period.
$(b)$ Which part of the graph represents the uniform motion of the car?
Solution
(N/A) The distance travelled by the car is equal to the area under the speed-time graph. To find the distance travelled in the first $4 \, s$,we calculate the area under the curve from $t = 0 \, s$ to $t = 4 \, s$. By observing the grid,the area is approximately a triangle with base $4 \, s$ and height $6 \, m/s$. Thus,the distance is $\frac{1}{2} \times \text{base} \times \text{height} = \frac{1}{2} \times 4 \, s \times 6 \, m/s = 12 \, m$.
$(b)$ Uniform motion is represented by a horizontal line in a speed-time graph,where the speed remains constant over time. In this graph,the part from $6 \, s$ to $10 \, s$ is a horizontal line,which represents the uniform motion of the car.
$(b)$ Uniform motion is represented by a horizontal line in a speed-time graph,where the speed remains constant over time. In this graph,the part from $6 \, s$ to $10 \, s$ is a horizontal line,which represents the uniform motion of the car.
0 likes
View Solution7
EasyMCQ
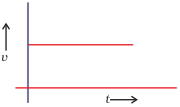
From the given $v-t$ graph (Fig.),it can be inferred that the object is
A
in uniform motion
B
at rest
C
in non-uniform motion
D
moving with uniform acceleration
Solution
(A) In a $v-t$ (velocity-time) graph,the $y$-axis represents velocity $(v)$ and the $x$-axis represents time $(t)$.
Since the graph is a straight horizontal line parallel to the time axis and above the zero mark on the $v$-axis,it indicates that the velocity of the object remains constant over time.
$A$ constant velocity implies that the object is in uniform motion.
Since the graph is a straight horizontal line parallel to the time axis and above the zero mark on the $v$-axis,it indicates that the velocity of the object remains constant over time.
$A$ constant velocity implies that the object is in uniform motion.
0 likes
View Solution8
EasyMCQ
The area under a $v-t$ graph represents a physical quantity which has the unit:
A
$m^2$
B
$m^3$
C
$m$
D
$ms^{-1}$
Solution
(C) The area under a velocity-time $(v-t)$ graph is calculated by multiplying velocity $(v)$ and time $(t)$.
Since $\text{velocity} = \text{displacement} / \text{time}$,the product of velocity and time gives displacement.
$\text{Area} = \text{velocity} \times \text{time} = (\text{m/s}) \times \text{s} = \text{m}$.
Therefore,the physical quantity represented by the area under a $v-t$ graph is displacement,and its $SI$ unit is meter $(m)$.
0 likes
View Solution9
MediumMCQ
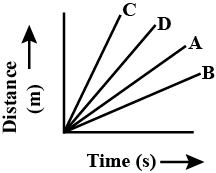
Four cars $A$,$B$,$C$ and $D$ are moving on a levelled road. Their distance versus time graphs are shown in the figure. Choose the correct statement.
A
Car $A$ is faster than car $D$.
B
Car $C$ is the slowest.
C
Car $D$ is faster than car $C$.
D
Car $B$ is the slowest.
Solution
(D) In a distance-time graph,the slope of the line represents the speed of the object.
Greater the slope,higher is the speed.
Looking at the graph,the line for car $C$ has the maximum slope,followed by $D$,$A$,and $B$.
Therefore,car $C$ is the fastest and car $B$ has the minimum slope,making it the slowest car.
Greater the slope,higher is the speed.
Looking at the graph,the line for car $C$ has the maximum slope,followed by $D$,$A$,and $B$.
Therefore,car $C$ is the fastest and car $B$ has the minimum slope,making it the slowest car.
0 likes
View Solution10
Medium
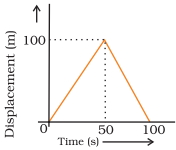
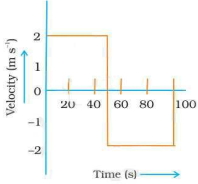
$A$ girl walks along a straight path to drop a letter in the letterbox and comes back to her initial position. Her displacement-time graph is shown in the figure. Plot a velocity-time graph for the same.
Solution
(N/A) $1$. From the displacement-time graph,the velocity is the slope of the line.
$2$. For the interval $0-50 \, s$,the displacement changes from $0 \, m$ to $100 \, m$. Thus,velocity $v_1 = \frac{100 \, m - 0 \, m}{50 \, s - 0 \, s} = 2 \, m/s$.
$3$. For the interval $50-100 \, s$,the displacement changes from $100 \, m$ to $0 \, m$. Thus,velocity $v_2 = \frac{0 \, m - 100 \, m}{100 \, s - 50 \, s} = \frac{-100 \, m}{50 \, s} = -2 \, m/s$.
$4$. The velocity-time graph will show a constant velocity of $2 \, m/s$ from $0$ to $50 \, s$ and a constant velocity of $-2 \, m/s$ from $50$ to $100 \, s$.
0 likes
View Solution11
MediumMCQ
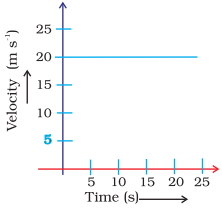
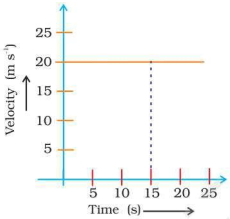
The velocity-time graph (Fig.) shows the motion of a cyclist. Find $(i)$ its acceleration $(ii)$ its velocity and $(iii)$ the distance covered by the cyclist in $15\,s$.
A
$0$,$20\,m/s$,$300\,m$
B
$10$,$20\,m/s$,$30\,m$
C
$0.5$,$20\,m/s$,$0.30\,m$
D
$0$,$0.2\,m/s$,$300\,m$
Solution
(A) $(i)$ Since the velocity-time graph is a horizontal line parallel to the time axis,the velocity is constant. Therefore,the acceleration is $0\,m/s^2$.
$(ii)$ By observing the graph,the constant velocity of the cyclist is $20\,m/s$.
$(iii)$ The distance covered by the cyclist in $15\,s$ is given by the area under the velocity-time graph,which is a rectangle with height $v = 20\,m/s$ and width $t = 15\,s$.
Distance $= v \times t = 20\,m/s \times 15\,s = 300\,m$.
18 likes
View Solution12
Medium
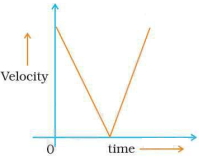
Draw a velocity versus time graph of a stone thrown vertically upwards and then coming downwards after attaining the maximum height.
Solution
(N/A) When a stone is thrown vertically upwards,its initial velocity is at its maximum. As the stone rises,its velocity decreases due to the constant downward acceleration due to gravity $(g)$.
At the maximum height,the velocity of the stone becomes zero.
After reaching the maximum height,the stone begins to fall downwards. During this phase,its velocity increases in the downward direction until it hits the ground.
The velocity-time graph for this motion is a straight line with a negative slope,representing constant deceleration during the upward journey and constant acceleration during the downward journey.
0 likes
View Solution13
Medium
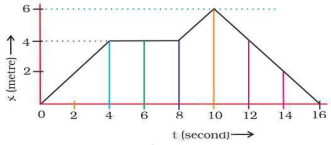
Using the following data,draw a time-displacement graph for a moving object:
Use this graph to find the average velocity for the first $4 \, s$,for the next $4 \, s$,and for the last $6 \, s$.
| Time $(s)$ | $0, 2, 4, 6, 8, 10, 12, 14, 16$ |
| Displacement $(m)$ | $0, 2, 4, 4, 4, 6, 4, 2, 0$ |
Use this graph to find the average velocity for the first $4 \, s$,for the next $4 \, s$,and for the last $6 \, s$.
Solution
(N/A) Average velocity is defined as the total change in displacement divided by the total time taken.
$1$. For the first $4 \, s$ ($t = 0$ to $4 \, s$):
Average velocity $v = \frac{\Delta x}{\Delta t} = \frac{4 - 0}{4 - 0} = \frac{4}{4} = 1 \, m/s$.
$2$. For the next $4 \, s$ ($t = 4$ to $8 \, s$):
Average velocity $v = \frac{\Delta x}{\Delta t} = \frac{4 - 4}{8 - 4} = \frac{0}{4} = 0 \, m/s$.
$3$. For the last $6 \, s$ ($t = 10$ to $16 \, s$):
Average velocity $v = \frac{\Delta x}{\Delta t} = \frac{0 - 6}{16 - 10} = \frac{-6}{6} = -1 \, m/s$.
0 likes
View Solution14
EasyMCQ
Mention the nature of motion of a body if its displacement$-$time graph is a straight line parallel to the time axis.
A
Uniform motion
B
Non-uniform motion
C
At rest
D
Accelerated motion
Solution
(C) If the displacement$-$time graph is a straight line parallel to the time axis,it indicates that the displacement of the body does not change with time.
Since the rate of change of displacement with respect to time is zero,the velocity of the body is zero.
Therefore,the body is at rest.
Since the rate of change of displacement with respect to time is zero,the velocity of the body is zero.
Therefore,the body is at rest.
0 likes
View Solution15
EasyMCQ
The displacement-time graph of a body is parallel to the time axis. What will you infer about the velocity of the body?
A
The velocity is constant and non-zero.
B
The velocity is zero.
C
The velocity is increasing.
D
The velocity is decreasing.
Solution
(B) In a displacement-time graph,the slope of the line represents the velocity of the body.
If the graph is parallel to the time axis,the displacement of the body does not change with time.
This means the body is at rest or stationary.
Since the body is not changing its position,its velocity is $0 \ m/s$.
If the graph is parallel to the time axis,the displacement of the body does not change with time.
This means the body is at rest or stationary.
Since the body is not changing its position,its velocity is $0 \ m/s$.
0 likes
View Solution16
EasyMCQ
What is the nature of the displacement-time graph of a body moving with constant velocity?
A
$A$ straight line parallel to the time axis
B
$A$ straight line passing through the origin
C
$A$ curved line
D
$A$ straight line not passing through the origin
Solution
(B) When a body moves with constant velocity,the displacement is directly proportional to time $(s = v \times t)$.
Since the relationship is linear,the displacement-time graph is a straight line.
If the body starts from the origin at time $t = 0$,the graph passes through the origin.
Since the relationship is linear,the displacement-time graph is a straight line.
If the body starts from the origin at time $t = 0$,the graph passes through the origin.
0 likes
View Solution17
EasyMCQ
What is the slope of the displacement $-$ time graph when the body has uniform motion?
A
Zero
B
Constant
C
Increasing
D
Decreasing
Solution
(B) In a displacement-time graph,the slope represents the velocity of the object.
When a body is in uniform motion,it covers equal displacements in equal intervals of time.
Therefore,the velocity remains constant.
Since the velocity is constant,the slope of the displacement-time graph is also constant.
When a body is in uniform motion,it covers equal displacements in equal intervals of time.
Therefore,the velocity remains constant.
Since the velocity is constant,the slope of the displacement-time graph is also constant.
0 likes
View Solution18
EasyMCQ
What is the nature of the displacement-time graph of a body moving with constant acceleration?
A
Straight line
B
Parabola
C
Circle
D
Hyperbola
Solution
(B) For a body moving with constant acceleration,the displacement $s$ is related to time $t$ by the kinematic equation $s = ut + \frac{1}{2}at^2$. Since $s$ is a quadratic function of $t$,the displacement-time graph is a parabola.
0 likes
View Solution19
EasyMCQ
How can you find the distance travelled by a body in uniform motion from the velocity$-$time graph?
A
By calculating the slope of the graph.
B
By calculating the area under the graph.
C
By calculating the intercept of the graph.
D
By calculating the product of velocity and time at a single point.
Solution
(B) In a velocity$-$time graph,the distance travelled by an object is equal to the area enclosed between the velocity$-$time curve and the time axis.
For uniform motion,the velocity$-$time graph is a straight line parallel to the time axis.
The area of the rectangle formed under this line represents the distance covered by the body during a specific time interval.
For uniform motion,the velocity$-$time graph is a straight line parallel to the time axis.
The area of the rectangle formed under this line represents the distance covered by the body during a specific time interval.
0 likes
View Solution20
EasyMCQ
If the displacement-time graph for a particle is parallel to the displacement axis,what is the velocity of the particle?
A
Zero
B
Constant
C
Infinity
D
Variable
Solution
(C) The velocity of a particle is defined as the rate of change of displacement with respect to time,which is given by the slope of the displacement-time graph $(v = \frac{ds}{dt})$.
If the displacement-time graph is parallel to the displacement axis,it implies that the displacement changes instantaneously at a single point in time.
Mathematically,the slope of a line parallel to the vertical axis is undefined or infinite.
Therefore,the velocity of the particle is infinite.
If the displacement-time graph is parallel to the displacement axis,it implies that the displacement changes instantaneously at a single point in time.
Mathematically,the slope of a line parallel to the vertical axis is undefined or infinite.
Therefore,the velocity of the particle is infinite.
0 likes
View Solution21
EasyMCQ
If the displacement $-$ time graph for a particle is parallel to the time axis, what is the velocity of the particle?
A
Positive
B
Negative
C
Zero
D
Infinite
Solution
(C) The velocity of a particle is defined as the rate of change of displacement with respect to time, given by the slope of the displacement $-$ time graph.
If the displacement $-$ time graph is parallel to the time axis, it means that the displacement of the particle does not change as time passes.
Since the displacement remains constant, the change in displacement $(\Delta s)$ is $0$.
Therefore, velocity $(v = \frac{\Delta s}{\Delta t})$ is $0$.
If the displacement $-$ time graph is parallel to the time axis, it means that the displacement of the particle does not change as time passes.
Since the displacement remains constant, the change in displacement $(\Delta s)$ is $0$.
Therefore, velocity $(v = \frac{\Delta s}{\Delta t})$ is $0$.
0 likes
View Solution22
Easy
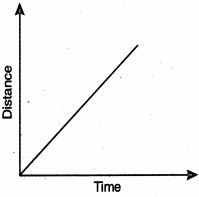
State the type of motion represented by the given graph.
Solution
The graph shows a straight line passing through the origin,representing a distance-time graph where the distance covered is directly proportional to the time taken.
This indicates that the object is moving with a constant speed.
Therefore,the type of motion represented is uniform motion.
This indicates that the object is moving with a constant speed.
Therefore,the type of motion represented is uniform motion.
0 likes
View Solution23
MediumMCQ
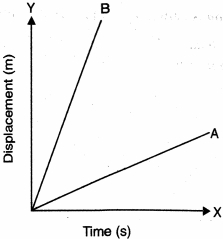
Two cars $A$ and $B$ have their displacement-time graph as given below. Which car has a greater velocity?
A
Car $A$
B
Car $B$
C
Both have equal velocity
D
Cannot be determined
Solution
(B) In a displacement-time graph,the slope of the line represents the velocity of the object.
Since the slope of the line for car $B$ is steeper than the slope of the line for car $A$,the velocity of car $B$ is greater than that of car $A$.
Since the slope of the line for car $B$ is steeper than the slope of the line for car $A$,the velocity of car $B$ is greater than that of car $A$.
0 likes
View Solution24
EasyMCQ
What can you say about the motion of a body if its displacement$-$time graph is a straight line parallel to the time axis?
A
The body is moving with uniform velocity.
B
The body is moving with uniform acceleration.
C
The body is at rest.
D
The body is moving with non-uniform velocity.
Solution
(C) In a displacement$-$time graph,the slope represents the velocity of the body.
If the graph is a straight line parallel to the time axis,the displacement of the body does not change with time.
This means the velocity of the body is $0 \ m/s$.
Therefore,the body is at rest.
If the graph is a straight line parallel to the time axis,the displacement of the body does not change with time.
This means the velocity of the body is $0 \ m/s$.
Therefore,the body is at rest.
0 likes
View Solution25
Medium
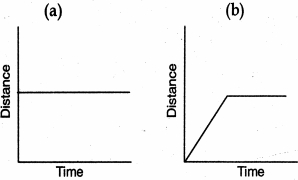
What kind of motion of a body is represented by the graphs given below?
Solution
(N/A) The graph shows a horizontal line parallel to the time axis,which indicates that the distance of the object does not change with time. Therefore,the object is at rest.
$(b)$ The graph shows a straight line for some time (uniform motion) followed by a horizontal line (rest). Since the speed is not constant throughout the entire duration,this represents non-uniform motion.
$(b)$ The graph shows a straight line for some time (uniform motion) followed by a horizontal line (rest). Since the speed is not constant throughout the entire duration,this represents non-uniform motion.
0 likes
View Solution26
Medium
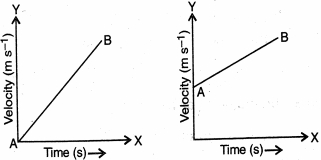
Give one similarity and one dissimilarity between the two graphs.
Solution
(N/A) Similarity: Both graphs are velocity-time graphs.
Dissimilarity: In the first graph,the body starts its journey from rest (initial velocity $u = 0$) with uniform acceleration. In the second graph,the body starts its journey with a specific initial velocity $(u > 0)$ and increases its velocity with uniform acceleration.
Dissimilarity: In the first graph,the body starts its journey from rest (initial velocity $u = 0$) with uniform acceleration. In the second graph,the body starts its journey with a specific initial velocity $(u > 0)$ and increases its velocity with uniform acceleration.
0 likes
View Solution27
Medium
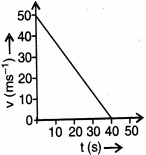
$(i)$ What can be depicted from the graph regarding the motion of the object?
$(ii)$ Find the value of acceleration from the graph.
$(ii)$ Find the value of acceleration from the graph.
Solution
(N/A) $(i)$ The graph shows a straight line with a negative slope,which indicates uniform retardation (deceleration) of the object.
$(ii)$ Acceleration $(a)$ is given by the slope of the velocity-time graph.
$a = \text{Slope} = \frac{v_2 - v_1}{t_2 - t_1}$
From the graph,at $t_1 = 0 \text{ s}$,$v_1 = 50 \text{ m s}^{-1}$ and at $t_2 = 40 \text{ s}$,$v_2 = 0 \text{ m s}^{-1}$.
$a = \frac{0 - 50 \text{ m s}^{-1}}{40 - 0 \text{ s}} = \frac{-50}{40} \text{ m s}^{-2} = -1.25 \text{ m s}^{-2}$
0 likes
View Solution28
Easy
What is the relation between distance and time:
$(i)$ when a body is moving with uniform velocity?
$(ii)$ when a body is moving with variable velocity?
$(i)$ when a body is moving with uniform velocity?
$(ii)$ when a body is moving with variable velocity?
Solution
(N/A) $(i)$ When a body moves with uniform velocity,the distance covered is directly proportional to the time taken $(s \propto t)$. This results in a linear graph.
$(ii)$ When a body moves with variable velocity,the distance covered is not directly proportional to the time taken. The rate of change of distance with respect to time is non-constant,resulting in a non-linear graph.
$(ii)$ When a body moves with variable velocity,the distance covered is not directly proportional to the time taken. The rate of change of distance with respect to time is non-constant,resulting in a non-linear graph.
0 likes
View Solution29
Medium
Mention some uses of velocity-time graphs.
Solution
(N/A) The velocity-time graphs have the following uses:
$(i)$ To determine the total distance travelled by a particle,which is equal to the area under the velocity-time graph.
$(ii)$ To determine the instantaneous velocity of the particle at any given time $t$.
$(iii)$ To determine the acceleration of the object,which is equal to the slope of the velocity-time graph.
0 likes
View Solution30
Medium
How can you find the following?
$(i)$ Velocity from a displacement-time graph.
$(ii)$ Acceleration from a velocity-time graph.
$(iii)$ Displacement from a velocity-time graph.
$(iv)$ Velocity from an acceleration-time graph.
$(i)$ Velocity from a displacement-time graph.
$(ii)$ Acceleration from a velocity-time graph.
$(iii)$ Displacement from a velocity-time graph.
$(iv)$ Velocity from an acceleration-time graph.
Solution
(N/A) $(i)$ By finding the slope of the displacement-time graph, where $v = \frac{\Delta \text{displacement}}{\Delta \text{time}}$.
$(ii)$ By finding the slope of the velocity-time graph, where $a = \frac{\Delta \text{velocity}}{\Delta \text{time}}$.
$(iii)$ By finding the area under the velocity-time graph, where $\text{Displacement} = \text{Area under } v-t \text{ graph}$.
$(iv)$ By finding the area under the acceleration-time graph, where $\Delta v = \text{Area under } a-t \text{ graph}$.
0 likes
View Solution31
Easy
What does the slope of a displacement$-$time graph represent? Can a displacement$-$time graph be parallel to the displacement axis? Give a reason for your answer.
Solution
(N/A) The slope of a displacement$-$time graph represents the velocity of the object.
No,a displacement$-$time graph cannot be parallel to the displacement axis.
This is because a line parallel to the displacement axis would imply that the object covers an infinite displacement in zero time,which is physically impossible.
No,a displacement$-$time graph cannot be parallel to the displacement axis.
This is because a line parallel to the displacement axis would imply that the object covers an infinite displacement in zero time,which is physically impossible.
0 likes
View Solution32
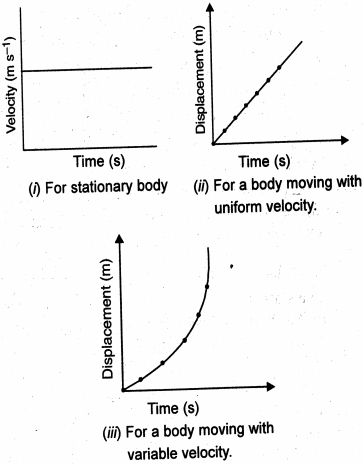
Medium
Draw displacement-time graphs for the following situations:
$(i)$ When a body is stationary.
$(ii)$ When a body is moving with uniform velocity.
$(iii)$ When a body is moving with variable velocity.
$(i)$ When a body is stationary.
$(ii)$ When a body is moving with uniform velocity.
$(iii)$ When a body is moving with variable velocity.
Solution
(N/A) $(i)$ When a body is stationary,its displacement does not change with time. Therefore,the displacement-time graph is a straight line parallel to the time axis.
$(ii)$ When a body is moving with uniform velocity,it covers equal displacements in equal intervals of time. Therefore,the displacement-time graph is a straight line inclined to the time axis.
$(iii)$ When a body is moving with variable velocity,it covers unequal displacements in equal intervals of time. Therefore,the displacement-time graph is a curved line.
0 likes
View Solution33
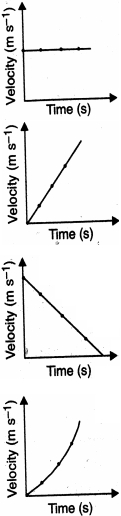
Medium
Draw velocity-time graphs for the following situations:
$(i)$ When a body is moving with uniform velocity.
$(ii)$ When a body is moving with variable velocity,but uniform acceleration.
$(iii)$ When a body is moving with variable velocity,but uniform retardation.
$(iv)$ When a body is moving with variable velocity and variable acceleration.
$(i)$ When a body is moving with uniform velocity.
$(ii)$ When a body is moving with variable velocity,but uniform acceleration.
$(iii)$ When a body is moving with variable velocity,but uniform retardation.
$(iv)$ When a body is moving with variable velocity and variable acceleration.
Solution
(N/A) The velocity-time graphs for the given situations are as follows:
$(i)$ For uniform velocity: The graph is a straight line parallel to the time axis,indicating that velocity does not change with time.
$(ii)$ For variable velocity with uniform acceleration: The graph is a straight line inclined to the time axis with a positive slope,indicating a constant rate of increase in velocity.
$(iii)$ For variable velocity with uniform retardation: The graph is a straight line inclined to the time axis with a negative slope,indicating a constant rate of decrease in velocity.
$(iv)$ For variable velocity and variable acceleration: The graph is a curve,indicating that the rate of change of velocity (acceleration) is not constant.
0 likes
View Solution34
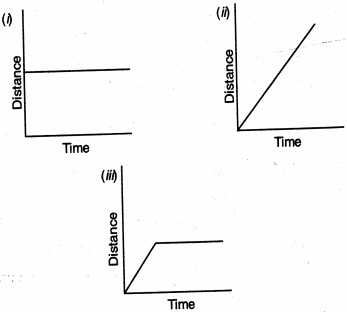
Medium
Can you suggest the kind of motion of a body from the following distance-time graphs?
Solution
(N/A) $(i)$ The graph is a horizontal line parallel to the time axis,which indicates that the distance of the body from the origin does not change with time. Therefore,the body is stationary.
$(ii)$ The graph is a straight line passing through the origin,which indicates that the body covers equal distances in equal intervals of time. Therefore,the body is moving with uniform velocity (or uniform speed).
$(iii)$ The graph shows that initially,the distance increases linearly with time,indicating uniform velocity. After a certain point,the graph becomes a horizontal line,meaning the distance remains constant over time. Therefore,the body initially moves with uniform velocity and then stops suddenly.
0 likes
View Solution35
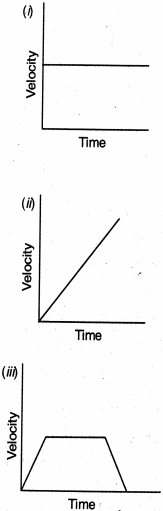
Medium
Can you suggest real-life examples of the motion of a body from the following velocity-time graphs?
Solution
(N/A) $(i)$ $A$ car moving with uniform velocity on a straight road.
$(ii)$ $A$ ball dropped from a height,falling freely under the action of gravity.
$(iii)$ $A$ train starting from a station,accelerating to a constant speed,moving with uniform velocity for some time,and then applying brakes to come to rest.
$(ii)$ $A$ ball dropped from a height,falling freely under the action of gravity.
$(iii)$ $A$ train starting from a station,accelerating to a constant speed,moving with uniform velocity for some time,and then applying brakes to come to rest.
0 likes
View Solution36
Medium
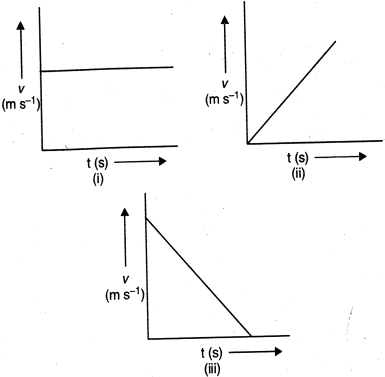
What can you conclude about the motion of a body depicted by the velocity-time graphs $(i)$,$(ii)$ and $(iii)$ given below?
Solution
(N/A) $(i)$ Uniform motion: The velocity of the body remains constant over time,meaning the acceleration is zero.
$(ii)$ Uniformly accelerated motion: The velocity of the body increases linearly with time,indicating a constant positive acceleration.
$(iii)$ Uniformly retarded motion (or deceleration): The velocity of the body decreases linearly with time,indicating a constant negative acceleration.
$(ii)$ Uniformly accelerated motion: The velocity of the body increases linearly with time,indicating a constant positive acceleration.
$(iii)$ Uniformly retarded motion (or deceleration): The velocity of the body decreases linearly with time,indicating a constant negative acceleration.
0 likes
View Solution37
Advanced
Two average students, Ram and Shyam, were discussing the following graphs in the class:
[Image: $1158-196$]
The question relating to the graphs was to identify which one of them was not possible. Ram and Shyam agreed that graphs $A, B$ and $C$ were not possible. But Shyam said that graph $D$ is possible, while Ram said that it is also not possible. Since their teacher was on leave, they could not ask her. Seeing this, Ratan, who was very intelligent, came to their rescue. He told Shyam that graph $D$ was also not possible.
$(a)$ Do you think that Ratan is right? If so, why is graph $D$ not possible?
$(b)$ What values are imbibed by Ratan?

Solution
$(D)$ Graph $D$ is not possible. This graph shows that at a given instant of time, the particle has two velocities. Also, it shows that at some point, it has infinite acceleration (graph parallel to the velocity axis). Both these conditions cannot be achieved in practice; therefore, this graph is also not possible.
$(b)$ Ratan exhibits values such as concern for his peers, helpfulness, and intelligence.
$(b)$ Ratan exhibits values such as concern for his peers, helpfulness, and intelligence.
0 likes
View Solution38
Medium
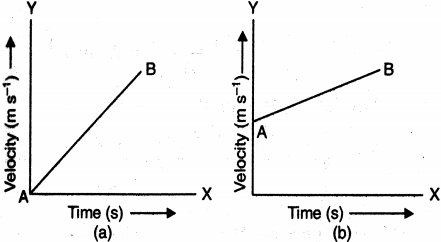
Explain the differences between the two graphs.
Solution
(N/A) This graph represents the uniform acceleration of a body that starts from rest. At time $t = 0$,the velocity of the body is $0 \ m/s$.
$(b)$ This graph represents the uniform acceleration of a body that does not start from rest. At time $t = 0$,the body already possesses an initial velocity represented by the intercept on the velocity axis.
$(b)$ This graph represents the uniform acceleration of a body that does not start from rest. At time $t = 0$,the body already possesses an initial velocity represented by the intercept on the velocity axis.
0 likes
View Solution39
Medium
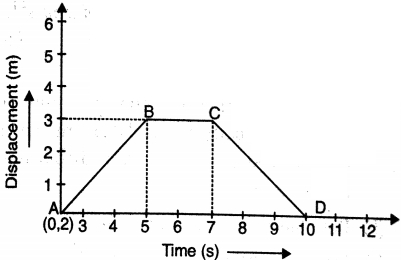
The following displacement-time graph shows the positions of a body at different times. Calculate the velocity of the body as it moves from: $(i) A-B, (ii) B-C, (iii) C-D$.
Solution
(N/A) Velocity is determined by the slope of the displacement-time graph,where $V = \frac{\Delta \text{displacement}}{\Delta \text{time}}$.
$(i)$ For segment $A-B$: The displacement changes from $0 \ m$ to $3 \ m$ in the time interval from $2 \ s$ to $5 \ s$.
$V_{AB} = \frac{3 - 0}{5 - 2} = \frac{3}{3} = 1 \ m \ s^{-1}$.
$(ii)$ For segment $B-C$: The displacement remains constant at $3 \ m$ from $5 \ s$ to $7 \ s$.
$V_{BC} = \frac{3 - 3}{7 - 5} = \frac{0}{2} = 0 \ m \ s^{-1}$.
$(iii)$ For segment $C-D$: The displacement changes from $3 \ m$ to $0 \ m$ in the time interval from $7 \ s$ to $10 \ s$.
$V_{CD} = \frac{0 - 3}{10 - 7} = \frac{-3}{3} = -1 \ m \ s^{-1}$.
0 likes
View Solution40
Medium
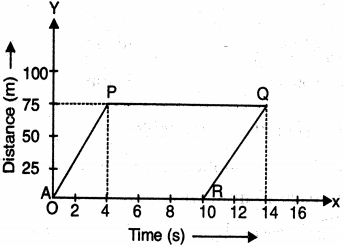
The graph given below is the distance-time graph of an object.
$(i)$ Find the speed of the object during the first four seconds of its journey.
(ii) How long was it stationary?
(iii) Does it represent a real situation? Justify your answer.
$(i)$ Find the speed of the object during the first four seconds of its journey.
(ii) How long was it stationary?
(iii) Does it represent a real situation? Justify your answer.
Solution
(N/A) $(i)$ The segment $OP$ indicates uniform speed.
Speed $v = \frac{\text{Distance}}{\text{Time}} = \frac{75 \ m - 0 \ m}{4 \ s - 0 \ s} = \frac{75}{4} = 18.75 \ m \ s^{-1}$.
(ii) The segment $PQ$ is parallel to the time axis,which indicates that the object is stationary. The duration is from $t = 4 \ s$ to $t = 14 \ s$,so the object was stationary for $14 - 4 = 10 \ s$.
(iii) The segment $QR$ represents a situation where the distance decreases as time increases,which is physically impossible for a single object moving in one dimension. Thus,this does not represent a real situation.
0 likes
View Solution41
Easy
$A$ person travelling in a bus noted the timings and the corresponding distances as indicated on the km stones. $(a)$ Name this type of table. $(b)$ What conclusion do you draw from this data?
| Time | Distance |
| $8.00\, am$ | $10\, km$ |
| $8.15\, am$ | $20\, km$ |
| $8.30\, am$ | $30\, km$ |
| $8.45\, am$ | $40\, km$ |
| $9.00\, am$ | $50\, km$ |
Solution
$(a)$ This is a distance-time table.
$(b)$ The bus is in uniform motion. This conclusion is drawn because the bus covers an equal distance of $10\, km$ in equal intervals of time ($15$ minutes each).
$(b)$ The bus is in uniform motion. This conclusion is drawn because the bus covers an equal distance of $10\, km$ in equal intervals of time ($15$ minutes each).
0 likes
View Solution42
Easy
$(a)$ Which type of motion is represented by the velocity-time graph shown below?
$(b)$ Name the physical quantity which can be calculated by the area of rectangle $OABC$.
$(c)$ What does the straight line $AB$ represent?
$(b)$ Name the physical quantity which can be calculated by the area of rectangle $OABC$.
$(c)$ What does the straight line $AB$ represent?
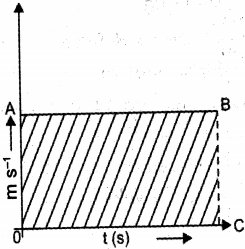
Solution
(N/A) The velocity-time graph shows a constant velocity over time,which represents uniform motion.
$(b)$ The area under a velocity-time graph represents the displacement of the object. Therefore,the area of rectangle $OABC$ represents the displacement.
$(c)$ The straight line $AB$ is parallel to the time axis,which indicates that the velocity of the object remains constant over time,representing uniform motion.
0 likes
View Solution43
Easy
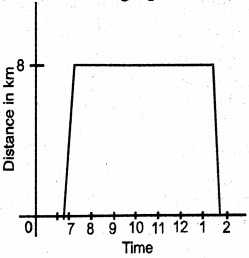
The following table shows the position of Renu, while she is going to her school. Draw a distance-time graph for her motion.
| Time | Distance from her home $(km)$ |
|---|---|
| $06:45 \, am$ | $0$ |
| $07:00 \, am$ | $8$ |
| $01:30 \, pm$ | $8$ |
| $01:45 \, pm$ | $0$ |
Solution
(N/A) To draw the distance-time graph, follow these steps:
$1$. Take the $x$-axis to represent time and the $y$-axis to represent distance in $km$.
$2$. Plot the given points: $(06:45, 0)$, $(07:00, 8)$, $(01:30, 8)$, and $(01:45, 0)$.
$3$. Join the points to obtain the graph. The graph shows that Renu travels $8 \, km$ to reach school, stays there for some time, and then returns home.
The distance-time graph is as shown in the provided image.
1 likes
View Solution44
Medium
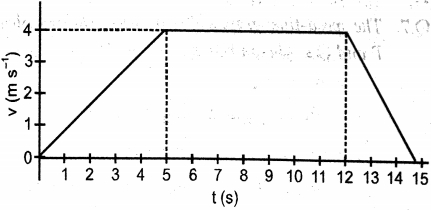
The velocity-time graph of a truck is plotted below.
$(a)$ Calculate the magnitude of displacement of the truck in $15$ seconds.
$(b)$ During which part of the journey was the truck decelerating?
$(c)$ Calculate the magnitude of average velocity of the truck.
$(a)$ Calculate the magnitude of displacement of the truck in $15$ seconds.
$(b)$ During which part of the journey was the truck decelerating?
$(c)$ Calculate the magnitude of average velocity of the truck.
Solution
(N/A) Displacement is equal to the area under the velocity-time graph.
Displacement $= \text{Area of triangle} + \text{Area of rectangle} + \text{Area of triangle}$
$= (\frac{1}{2} \times 5 \times 4) + ((12 - 5) \times 4) + (\frac{1}{2} \times (15 - 12) \times 4)$
$= 10 + 28 + 6 = 44 \text{ m}$
$(b)$ The truck is decelerating when the velocity decreases with time,which occurs between $12 \text{ s}$ and $15 \text{ s}$.
$(c)$ Average velocity $= \frac{\text{Total displacement}}{\text{Total time}}$
$= \frac{44 \text{ m}}{15 \text{ s}} \approx 2.93 \text{ m s}^{-1}$
0 likes
View Solution45
Easy
$(a)$ When will you say a body is in $(i)$ uniform motion $(ii)$ non-uniform motion?
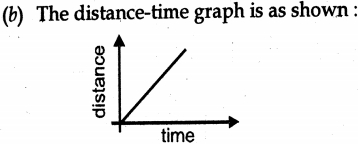
$(b)$ Show the path of an object when it is in uniform motion with the help of a graph.
$(b)$ Show the path of an object when it is in uniform motion with the help of a graph.
Solution
(N/A) $(i)$ $A$ body is said to be in uniform motion if it covers equal distances in equal intervals of time.
$(ii)$ $A$ body is said to be in non-uniform motion if it covers unequal distances in equal intervals of time.
$(b)$ For an object in uniform motion,the distance-time graph is a straight line passing through the origin,as shown below:
[Graph: $A$ straight line starting from the origin $(0,0)$ on a Cartesian plane where the y-axis represents 'distance' and the x-axis represents 'time'.]
0 likes
View Solution46
Easy
Name the physical quantities denoted by:
$(i)$ The slope of the distance$-$time graph.
$(ii)$ The area under a velocity$-$time graph.
$(iii)$ The slope of a velocity$-$time graph.
$(i)$ The slope of the distance$-$time graph.
$(ii)$ The area under a velocity$-$time graph.
$(iii)$ The slope of a velocity$-$time graph.
Solution
(N/A) $(i)$ The slope of the distance$-$time graph represents the speed of the object.
$(ii)$ The area under a velocity$-$time graph represents the total displacement or distance covered by the object.
$(iii)$ The slope of a velocity$-$time graph represents the acceleration of the object.
$(ii)$ The area under a velocity$-$time graph represents the total displacement or distance covered by the object.
$(iii)$ The slope of a velocity$-$time graph represents the acceleration of the object.
0 likes
View Solution47
Medium
The slope of the line on a position-time graph reveals information about an object's velocity. What conclusion can you draw regarding the motion of an object,if the graph is a
$(i)$ Horizontal line.
$(ii)$ Straight diagonal line.
$(iii)$ Curved line.
$(i)$ Horizontal line.
$(ii)$ Straight diagonal line.
$(iii)$ Curved line.
Solution
(N/A) $(i)$ $A$ horizontal line indicates that the position of the object does not change with time,meaning the object is at rest.
$(ii)$ $A$ straight diagonal line indicates a constant slope,which means the object is moving with uniform velocity (constant speed).
$(iii)$ $A$ curved line indicates a changing slope,which means the object is moving with non-uniform velocity (variable speed/acceleration).
$(ii)$ $A$ straight diagonal line indicates a constant slope,which means the object is moving with uniform velocity (constant speed).
$(iii)$ $A$ curved line indicates a changing slope,which means the object is moving with non-uniform velocity (variable speed/acceleration).
0 likes
View Solution48
Medium
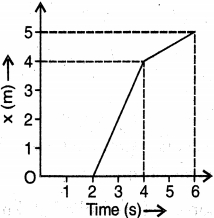
The position-time graph for the motion of a car is given below.
$(i)$ How far did the car travel in the time interval $2 \, s$ to $6 \, s$?
(ii) During which interval of time was its speed greater?
(iii) Calculate the average speed of the car.
$(i)$ How far did the car travel in the time interval $2 \, s$ to $6 \, s$?
(ii) During which interval of time was its speed greater?
(iii) Calculate the average speed of the car.
Solution
(N/A) $(i)$ At $t = 2 \, s$,position $x = 0 \, m$. At $t = 6 \, s$,position $x = 5 \, m$. Therefore,distance traveled $= 5 \, m - 0 \, m = 5 \, m$.
(ii) The speed is represented by the slope of the position-time graph. The slope is steeper between $2 \, s$ and $4 \, s$ compared to the interval between $4 \, s$ and $6 \, s$. Thus,the speed was greater during the interval $2 \, s$ to $4 \, s$.
(iii) Average speed $= \frac{\text{Total distance covered}}{\text{Total time taken}}$.
Total distance $= 5 \, m$.
Total time $= 6 \, s - 2 \, s = 4 \, s$.
Average speed $= \frac{5 \, m}{4 \, s} = 1.25 \, m/s$.
0 likes
View Solution49
Medium
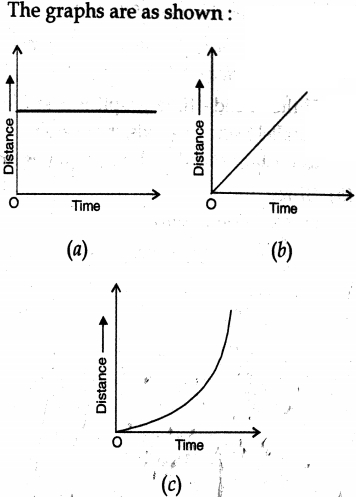
Draw the distance$-$time graph for the following situations:
$(a)$ When a body is stationary.
$(b)$ When a body is moving with a uniform speed.
$(c)$ When a body is moving with non$-$uniform speed.
$(a)$ When a body is stationary.
$(b)$ When a body is moving with a uniform speed.
$(c)$ When a body is moving with non$-$uniform speed.
Solution
(N/A) When a body is stationary,its distance from the origin does not change with time. The graph is a straight line parallel to the time axis.
$(b)$ When a body is moving with a uniform speed,it covers equal distances in equal intervals of time. The graph is a straight line passing through the origin.
$(c)$ When a body is moving with non$-$uniform speed,it covers unequal distances in equal intervals of time. The graph is a curved line.
$(b)$ When a body is moving with a uniform speed,it covers equal distances in equal intervals of time. The graph is a straight line passing through the origin.
$(c)$ When a body is moving with non$-$uniform speed,it covers unequal distances in equal intervals of time. The graph is a curved line.
0 likes
View Solution50
Medium
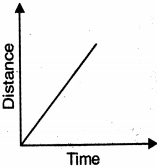
Velocity-time graph for the motion of an object in a straight path is a straight line parallel to the time axis.
$(a)$ Identify the nature of motion of the body.
$(b)$ Find the acceleration of the body.
$(c)$ Draw the shape of distance-time graph for this type of motion.
$(a)$ Identify the nature of motion of the body.
$(b)$ Find the acceleration of the body.
$(c)$ Draw the shape of distance-time graph for this type of motion.
Solution
(N/A) If the velocity-time graph is a straight line parallel to the time axis,the object moves with a constant velocity and the motion is uniform.
$(b)$ Since velocity is constant,the change in velocity is zero. Therefore,acceleration,which is the rate of change of velocity,is zero.
$(c)$ For uniform motion,the distance-time graph is a straight line passing through the origin,as shown in the image.
$(b)$ Since velocity is constant,the change in velocity is zero. Therefore,acceleration,which is the rate of change of velocity,is zero.
$(c)$ For uniform motion,the distance-time graph is a straight line passing through the origin,as shown in the image.
0 likes
View SolutionMOTION — Graphical Representation of Motion · Frequently Asked Questions
1Are these MOTION questions useful for JEE and NEET?
Yes. All questions in this section are mapped to JEE Main and NEET exam patterns. Previous year questions from JEE Main, NEET, GUJCET and state-level exams are included with full solutions.
2Can I switch to Hindi or Gujarati for these questions?
Yes. Use the language tabs in the hero section or the sidebar to view the same questions and solutions in English, Hindi or Gujarati.
3How do I generate a question paper from this subtopic?
Use the Vedclass Exam Paper Generator — select the chapter and subtopic, set difficulty, and generate Sets A, B, C, D automatically. First 3 chapters of every subject are free.
Vedclass Products
For Students
Vedclass Test Series
Mock tests in real JEE/NEET style with performance analysis. 5-day free trial.
Start Free TrialFor Teachers
Exam Paper Generator
Generate Set A/B/C/D papers from this chapter in 2 minutes. 3 chapters free.
Try FreeFor Institutes
Online Exam Module
Live online exams with unlimited students, 360° analytics & white-label branding.
See DemoFor Teachers & Institutes
Generate a MOTION Exam Paper in 2 Minutes
Select subtopic & difficulty — Sets A, B, C, D auto-generated with No Repeat logic.
First 3 chapters of every subject are free — no payment required.