
A English
Graphical Representation of Motion Questions in English
Class 9 Science · MOTION · Graphical Representation of Motion
83+
Questions
English
Language
100%
With Solutions
Showing 33 of 83 questions in English
51
Medium
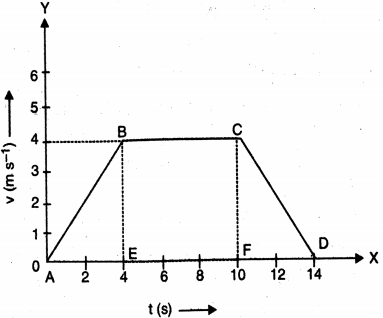
Study the given velocity-time graph and answer the following questions:
$(i)$ Which part of the graph shows accelerated motion?
$(ii)$ Which part of the graph shows retarded motion?
$(iii)$ Calculate the distance travelled by the body in the first $4 \ s$ of the journey graphically.
$(i)$ Which part of the graph shows accelerated motion?
$(ii)$ Which part of the graph shows retarded motion?
$(iii)$ Calculate the distance travelled by the body in the first $4 \ s$ of the journey graphically.
Solution
(N/A) $(i)$ The part $AB$ of the graph shows acceleration,as the velocity increases with time.
$(ii)$ The part $CD$ of the graph shows retardation (deceleration),as the velocity decreases with time.
$(iii)$ The distance travelled is equal to the area under the $v-t$ graph.
For the first $4 \ s$,the area is represented by the triangle $ABE$.
Distance $S = \text{Area of } \Delta ABE = \frac{1}{2} \times \text{base} \times \text{height}$
$S = \frac{1}{2} \times (AE) \times (BE)$
$S = \frac{1}{2} \times 4 \ s \times 4 \ m/s = 8 \ m$.
0 likes
View Solution52
Medium
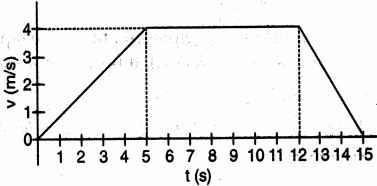
The velocity$-$time graph of a truck is plotted below.
$(a)$ Calculate the magnitude of displacement of the truck in $15$ seconds.
$(b)$ During which part of the journey was the truck decelerating?
$(c)$ Calculate the magnitude of average velocity of the truck.
$(a)$ Calculate the magnitude of displacement of the truck in $15$ seconds.
$(b)$ During which part of the journey was the truck decelerating?
$(c)$ Calculate the magnitude of average velocity of the truck.
Solution
(N/A) Displacement is equal to the area under the velocity$-$time graph.
The graph consists of a triangle from $t = 0$ to $t = 5$ s, a rectangle from $t = 5$ to $t = 12$ s, and a triangle from $t = 12$ to $t = 15$ s.
Area $= (1/2 \times \text{base} \times \text{height}) + (\text{length} \times \text{breadth}) + (1/2 \times \text{base} \times \text{height})$
Area $= (1/2 \times 5 \times 4) + (7 \times 4) + (1/2 \times 3 \times 4) = 10 + 28 + 6 = 44 \text{ m}$.
$(b)$ Deceleration occurs when the velocity decreases with time. This corresponds to the part of the graph where the slope is negative, which is from $t = 12$ s to $t = 15$ s.
$(c)$ Average velocity $= \text{Total displacement} / \text{Total time} = 44 \text{ m} / 15 \text{ s} = 2.93 \text{ m s}^{-1}$.
0 likes
View Solution53
Medium
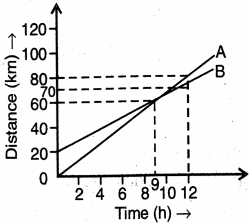
The distance-time graph below represents the motion of two buses $A$ and $B$.
$(i)$ What is the distance by which bus $B$ was ahead of bus $A$ initially?
$(ii)$ Do they ever meet each other? If so,when?
$(iii)$ What is the distance travelled by bus $A$ when it overtakes bus $B$?
$(iv)$ Find out the distance by which bus $A$ was ahead of bus $B$ at $t = 12 \ h$.
$(v)$ Which one of them is moving faster? Give reason.
Solution
(N/A) $(i)$ At $t = 0 \ h$,bus $B$ is at $20 \ km$ and bus $A$ is at $0 \ km$. Thus,bus $B$ was ahead by $20 \ km$.
$(ii)$ Yes,they meet at the point where the two lines intersect,which is at $t = 9 \ h$.
$(iii)$ At the point of intersection $(t = 9 \ h)$,the distance on the $y$-axis is $60 \ km$. Thus,bus $A$ has travelled $60 \ km$.
$(iv)$ At $t = 12 \ h$,bus $A$ is at $80 \ km$ and bus $B$ is at $70 \ km$. The difference is $80 \ km - 70 \ km = 10 \ km$.
$(v)$ Bus $A$ is moving faster because the slope of its distance-time graph is steeper than that of bus $B$,indicating a higher speed.
0 likes
View Solution54
Medium
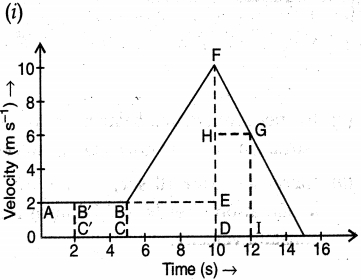
$A$ body moves with a velocity of $2\, m s^{-1}$ for $5\, s$,then its velocity increases uniformly to $10\, m s^{-1}$ in the next $5\, s$. Thereafter,its velocity begins to decrease at a uniform rate until it comes to rest after $5\, s$.
$(i)$ Plot a velocity-time graph for the motion of the body.
$(ii)$ From the graph,find the total distance covered by the body after $2\, s$ and $12\, s$.
$(i)$ Plot a velocity-time graph for the motion of the body.
$(ii)$ From the graph,find the total distance covered by the body after $2\, s$ and $12\, s$.
Solution
(N/A) $(ii)$ According to the velocity-time graph:
Distance moved by the body after $2\, s$ is equal to the area under the graph from $t = 0$ to $t = 2\, s$.
Area $= 2\, m s^{-1} \times 2\, s = 4\, m$.
Distance covered by the body after $12\, s$ is the total area under the graph from $t = 0$ to $t = 12\, s$.
This area consists of the rectangle for the first $5\, s$,the trapezoid for the next $5\, s$,and the trapezoid for the final $2\, s$ (from $t = 10\, s$ to $t = 12\, s$).
Total Distance $= (2\, m s^{-1} \times 5\, s) + \frac{1}{2} \times (2\, m s^{-1} + 10\, m s^{-1}) \times 5\, s + \frac{1}{2} \times (10\, m s^{-1} + 6\, m s^{-1}) \times 2\, s$
$= 10\, m + 30\, m + 16\, m = 56\, m$.
0 likes
View Solution55
Medium
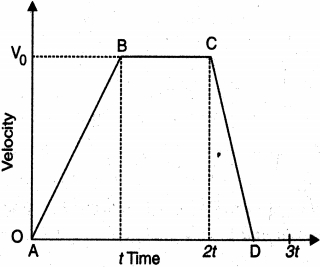
The diagram shows a velocity-time graph for a car starting from rest. The graph has three sections $AB$,$BC$,and $CD$.
$(i)$ From a study of this graph,state how the distance travelled in any section is determined.
$(ii)$ Compare the distance travelled in section $BC$ with the distance travelled in section $AB$.
$(iii)$ In which section does the car have zero acceleration?
$(iv)$ Is the magnitude of acceleration higher or lower than that of retardation? Give a reason.
Solution
(N/A) $(i)$ The distance travelled in any section is determined by calculating the area under the velocity-time graph for that specific section.
$(ii)$ Distance in section $AB$ = Area of triangle $OAB = \frac{1}{2} \times \text{base} \times \text{height} = \frac{1}{2} \times t \times V_{0} = \frac{1}{2} V_{0}t$.
Distance in section $BC$ = Area of rectangle under $BC = \text{length} \times \text{breadth} = (2t - t) \times V_{0} = t \times V_{0} = V_{0}t$.
Comparing the two,the distance in section $BC$ is twice the distance in section $AB$ (Ratio $2:1$).
$(iii)$ In section $BC$,the velocity is constant,so the car has zero acceleration.
$(iv)$ The magnitude of acceleration is lower than that of retardation.
Reason: The magnitude of acceleration is the slope of $AB = \frac{V_{0}}{t}$.
The magnitude of retardation is the slope of $CD = \frac{V_{0}}{3t - 2t} = \frac{V_{0}}{t}$? Wait,looking at the graph,$D$ is at $2.5t$ or similar? Let's re-evaluate: The slope of $AB = \frac{V_{0}}{t}$. The slope of $CD = \frac{V_{0}}{0.5t} = 2\frac{V_{0}}{t}$. Thus,retardation is higher.
0 likes
View Solution56
Medium
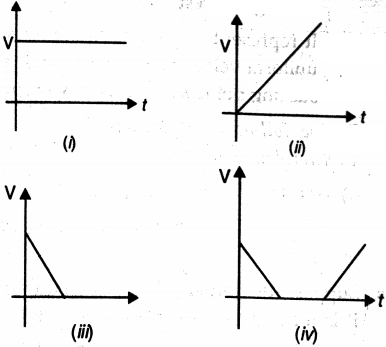
What can we conclude about the motion of a body depicted by the following velocity-time graphs?
Solution
(N/A) $(i)$ The graph shows a horizontal line parallel to the time axis,indicating that the velocity remains constant over time. This represents a body moving with uniform velocity.
$(ii)$ The graph shows a straight line passing through the origin with a positive slope,indicating that the velocity increases linearly with time. This represents a body moving with uniform acceleration.
$(iii)$ The graph shows a straight line with a negative slope,indicating that the velocity decreases linearly with time until it reaches zero. This represents a body moving with uniform retardation (deceleration).
$(iv)$ The graph shows the velocity decreasing linearly to zero (uniform retardation),remaining at zero for a certain time interval (at rest),and then increasing linearly (uniform acceleration).
0 likes
View Solution57
MediumMCQ
What is the nature of motion of a particle depicted by the following displacement-time graphs?
A
$(i)$ Uniform velocity,(ii) Rest,(iii) Uniform acceleration,(iv) Non-uniform velocity
B
$(i)$ Rest,(ii) Uniform velocity,(iii) Uniform acceleration,(iv) Non-uniform velocity
C
$(i)$ Rest,(ii) Uniform velocity,(iii) Uniform velocity then rest,(iv) Uniform velocity then return
D
$(i)$ Uniform velocity,(ii) Rest,(iii) Uniform velocity then rest,(iv) Uniform velocity then return
Solution
(C) $(i)$ The graph is a horizontal line parallel to the time axis,indicating that displacement does not change with time; therefore,the particle is at rest.
$(ii)$ The graph is a straight line inclined to the time axis,indicating that displacement changes at a constant rate; therefore,the particle is moving with uniform velocity.
$(iii)$ The graph shows a straight line with a constant slope followed by a horizontal line,indicating the particle moves with uniform velocity and then suddenly comes to rest.
$(iv)$ The graph shows a straight line with a positive slope followed by a straight line with a negative slope returning to the zero displacement axis,indicating the particle moves with uniform velocity and then returns to the starting point with the same speed.
0 likes
View Solution58
Medium
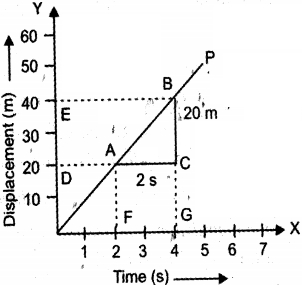
What do you understand by the displacement-time graph? Draw a displacement-time graph for a girl going to school with uniform velocity. How can we calculate the uniform velocity from it?
Solution
(N/A) In the displacement-time graph,the time is taken on the $x$-axis and the displacement of the body is taken on the $y$-axis.
Since $\text{Velocity} = \frac{\text{Displacement}}{\text{Time}}$,the slope of the displacement-time graph gives the velocity.
For a girl going to school on a straight path in a given direction with a uniform speed,the displacement-time graph is a straight line passing through the origin (as shown in the figure).
The velocity of the girl can be obtained by finding the slope of the straight line $OP$.
Using the points $A$ and $B$ on the graph:
$\text{Velocity} (v) = \frac{\text{Change in displacement}}{\text{Change in time}} = \frac{BC}{AC} = \frac{40 \text{ m} - 20 \text{ m}}{4 \text{ s} - 2 \text{ s}} = \frac{20 \text{ m}}{2 \text{ s}} = 10 \text{ m s}^{-1}$.
0 likes
View Solution59
Difficult
What is a velocity-time graph? State how it can be used to find:
$(i)$ The acceleration of a body.
$(ii)$ The displacement of the body.
$(iii)$ The distance travelled in a given time.
$(i)$ The acceleration of a body.
$(ii)$ The displacement of the body.
$(iii)$ The distance travelled in a given time.
Solution
(N/A) In a velocity-time graph,time is plotted along the $x$-axis and velocity is plotted along the $y$-axis.
$(i)$ Since acceleration $=$ Change in velocity $/$ Time,the slope of the velocity-time graph gives the acceleration. If the slope is positive,it represents accelerated motion; if the slope is negative,it represents retarded motion.
$(ii)$ Since velocity $\times$ time $=$ displacement,the area enclosed between the graph and the time axis represents the displacement. The area above the time axis is considered positive displacement,and the area below the time axis is considered negative displacement. The total displacement is the algebraic sum of these areas.
$(iii)$ The total distance travelled by the body is the arithmetic sum of the magnitudes of the areas enclosed by the velocity-time graph and the time axis (ignoring the sign).
0 likes
View Solution60
Medium
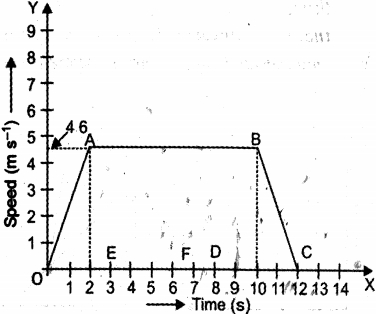
The velocity$-$time graph of an ascending passenger lift is as shown in the figure below.
$(i)$ Identify the kind of motion of the lift represented by lines $OA$ and $BC$.
$(ii)$ Calculate the acceleration of the lift:
$(a)$ During the first two seconds.
$(b)$ Between the $3^{rd}$ and $10^{th}$ second.
$(c)$ During the last two seconds.
$(i)$ Identify the kind of motion of the lift represented by lines $OA$ and $BC$.
$(ii)$ Calculate the acceleration of the lift:
$(a)$ During the first two seconds.
$(b)$ Between the $3^{rd}$ and $10^{th}$ second.
$(c)$ During the last two seconds.
Solution
(N/A) $(i)$ The motion represented by line $OA$ is uniformly accelerated motion,and the motion represented by line $BC$ is uniformly retarded motion (deceleration).
$(ii)$ The acceleration of the lift is calculated as follows:
$(a)$ During the first two seconds (from $OA$):
Initial velocity $u = 0 \ m/s$,final velocity $v = 4.6 \ m/s$,time $t = 2 \ s$.
$a = \frac{v - u}{t} = \frac{4.6 - 0}{2} = 2.3 \ m/s^2$.
$(b)$ Between the $3^{rd}$ and $10^{th}$ second,the graph is a straight line parallel to the time axis,which indicates constant velocity. Therefore,the acceleration is $0 \ m/s^2$.
$(c)$ During the last two seconds (from $BC$):
Initial velocity $u = 4.6 \ m/s$,final velocity $v = 0 \ m/s$,time $t = 12 - 10 = 2 \ s$.
$a = \frac{v - u}{t} = \frac{0 - 4.6}{2} = -2.3 \ m/s^2$.
0 likes
View Solution61
Medium
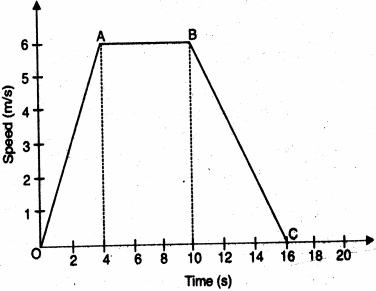
Study the speed-time graph of a body given below and answer the following questions:
$(i)$ What type of motion is represented by $OA$,$AB$ and $BC$?
(ii) Find positive and negative accelerations of the body.
(iii) Find the distance travelled by the body from $A$ to $B$.
$(i)$ What type of motion is represented by $OA$,$AB$ and $BC$?
(ii) Find positive and negative accelerations of the body.
(iii) Find the distance travelled by the body from $A$ to $B$.
Solution
(N/A) $(i)$ $OA$ represents uniform acceleration. $AB$ represents uniform motion (zero acceleration,moving with constant velocity). $BC$ represents negative acceleration (retardation).
(ii) Acceleration is the slope of the graph:
Positive acceleration $(OA)$ = $\frac{6 - 0}{4 - 0} = 1.5 \text{ m s}^{-2}$.
Negative acceleration $(BC)$ = $\frac{0 - 6}{16 - 10} = \frac{-6}{6} = -1 \text{ m s}^{-2}$.
(iii) Distance travelled is the area under the graph between $A$ and $B$:
Distance = $\text{Speed} \times \text{Time} = 6 \text{ m/s} \times (10 - 4) \text{ s} = 6 \times 6 = 36 \text{ m}$.
0 likes
View Solution62
Medium
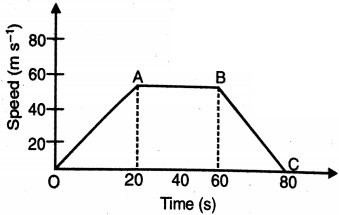
Study the speed-time graph of a car below and answer the following questions:
$(a)$ What type of motion is represented by $OA$?
$(b)$ Find the acceleration from $B$ to $C$.
$(c)$ Calculate the distance covered by the body from $A$ to $B$.
$(a)$ What type of motion is represented by $OA$?
$(b)$ Find the acceleration from $B$ to $C$.
$(c)$ Calculate the distance covered by the body from $A$ to $B$.
Solution
(N/A) The segment $OA$ represents uniform acceleration,as the speed increases linearly with time.
$(b)$ Acceleration is given by the slope of the speed-time graph. For the segment $BC$,the initial speed at $B$ is $60 \ m/s$ at $t = 60 \ s$,and the final speed at $C$ is $0 \ m/s$ at $t = 80 \ s$.
$a = \frac{v - u}{t_2 - t_1} = \frac{0 - 60}{80 - 60} = \frac{-60}{20} = -3 \ m/s^2$.
Thus,the acceleration is $-3 \ m/s^2$ (retardation).
$(c)$ The distance covered is equal to the area under the speed-time graph. For the segment $AB$,the motion is at a constant speed of $60 \ m/s$ from $t = 20 \ s$ to $t = 60 \ s$.
Distance = $\text{Speed} \times \text{Time} = 60 \ m/s \times (60 - 20) \ s = 60 \times 40 = 2400 \ m$.
0 likes
View Solution63
Medium
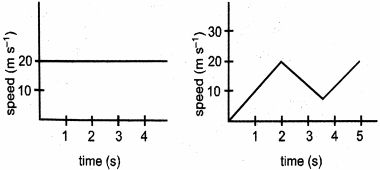
Two graphs for the motion of objects moving along a straight line are shown. State how the speed is changing with time in both cases.
Solution
(N/A) Case $1$: The graph is a horizontal straight line parallel to the time axis. This indicates that the speed of the object remains constant at $20 \text{ m s}^{-1}$ over time.
Case $2$: The graph shows that the speed is changing continuously with time. The speed increases from $0$ to $20 \text{ m s}^{-1}$ between $0$ and $2 \text{ s}$,then decreases to $10 \text{ m s}^{-1}$ at $3.5 \text{ s}$,and finally increases again. Thus,the object is moving with variable speed.
Case $2$: The graph shows that the speed is changing continuously with time. The speed increases from $0$ to $20 \text{ m s}^{-1}$ between $0$ and $2 \text{ s}$,then decreases to $10 \text{ m s}^{-1}$ at $3.5 \text{ s}$,and finally increases again. Thus,the object is moving with variable speed.
0 likes
View Solution64
Medium
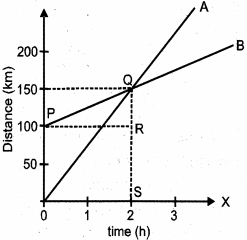
The distance-time graph of two trains is given below. The trains start simultaneously in the same direction.
$(i)$ How much ahead of $A$ is $B$ when the motion starts?
$(ii)$ What is the speed of $B$?
$(iii)$ When and where will $A$ catch $B$?
$(iv)$ What is the difference between the speeds of $A$ and $B$?
$(v)$ Is the speed of either train uniform or non-uniform? Justify your answer.
$(i)$ How much ahead of $A$ is $B$ when the motion starts?
$(ii)$ What is the speed of $B$?
$(iii)$ When and where will $A$ catch $B$?
$(iv)$ What is the difference between the speeds of $A$ and $B$?
$(v)$ Is the speed of either train uniform or non-uniform? Justify your answer.
Solution
(N/A) $(i)$ At $t = 0$,train $A$ is at $0 \ km$ and train $B$ is at $100 \ km$. Thus,$B$ is $100 \ km$ ahead of $A$.
$(ii)$ Speed of $B = \frac{\text{Distance}}{\text{Time}} = \frac{150 \ km - 100 \ km}{2 \ h - 0 \ h} = \frac{50 \ km}{2 \ h} = 25 \ km/h$.
$(iii)$ $A$ catches $B$ at the point of intersection $Q$,which corresponds to $2 \ h$ and $150 \ km$. So,$A$ catches $B$ after $2 \ h$ at a distance of $150 \ km$.
$(iv)$ Speed of $A = \frac{150 \ km - 0 \ km}{2 \ h - 0 \ h} = 75 \ km/h$. Speed of $B = 25 \ km/h$. The difference is $75 \ km/h - 25 \ km/h = 50 \ km/h$.
$(v)$ The speed of both trains is uniform because their distance-time graphs are straight lines,indicating a constant rate of change of distance with respect to time.
0 likes
View Solution65
Medium
What can you say about the motion of an object whose distance-time graph is:
$(i)$ a straight line,parallel to the time axis?
$(ii)$ a straight line passing through the origin making an angle with the time axis?
$(i)$ a straight line,parallel to the time axis?
$(ii)$ a straight line passing through the origin making an angle with the time axis?
Solution
(N/A) $(i)$ If the distance-time graph is a straight line parallel to the time axis,it means that the distance of the object from the origin does not change with time. Therefore,the object is stationary (at rest).
$(ii)$ If the distance-time graph is a straight line passing through the origin,it indicates that the object covers equal distances in equal intervals of time. Therefore,the object is in uniform motion.
$(ii)$ If the distance-time graph is a straight line passing through the origin,it indicates that the object covers equal distances in equal intervals of time. Therefore,the object is in uniform motion.
0 likes
View Solution66
Difficult
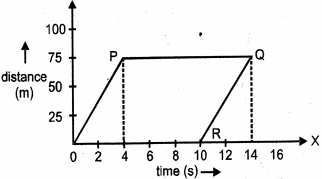
The graph given below is the distance-time graph of an object.
$(i)$ Find the speed of the object during the first four seconds of its journey.
(ii) How long was it stationary?
(iii) Does it represent a real-life situation? Justify your answer.
$(i)$ Find the speed of the object during the first four seconds of its journey.
(ii) How long was it stationary?
(iii) Does it represent a real-life situation? Justify your answer.
Solution
(N/A) $(i)$ Speed is the slope of the distance-time graph. For the first $4 \ s$,the distance covered is $75 \ m$.
Speed $= \frac{\text{Distance}}{\text{Time}} = \frac{75 \ m}{4 \ s} = 18.75 \ m \ s^{-1}$.
(ii) The object is stationary when the distance remains constant over time. This corresponds to the horizontal line segment $PQ$. The object is stationary from $t = 4 \ s$ to $t = 14 \ s$.
Duration $= 14 \ s - 4 \ s = 10 \ s$.
(iii) No,this graph does not represent a real-life situation. In a real-life scenario,the distance covered by an object cannot decrease with time. The segment $RQ$ shows the object moving from a distance of $0 \ m$ to $75 \ m$ between $10 \ s$ and $14 \ s$,but the graph implies the object was at $75 \ m$ at $t=4 \ s$ and then suddenly appears at $0 \ m$ at $t=10 \ s$,which is physically impossible.
0 likes
View Solution67
Medium
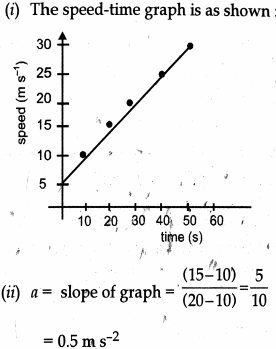
$A$ car is moving on a straight road with uniform acceleration. The following table gives the speed of the car at various instants of time.
$(i)$ Draw the speed-time graph representing the above set of observations.
$(ii)$ Find the acceleration of the car.
| Time $(s)$ | $0$ | $10$ | $20$ | $30$ | $40$ | $50$ |
| Speed $(m s^{-1})$ | $5$ | $10$ | $15$ | $20$ | $25$ | $30$ |
$(i)$ Draw the speed-time graph representing the above set of observations.
$(ii)$ Find the acceleration of the car.
Solution
(N/A) $(i)$ The speed-time graph is plotted by taking time on the $x$-axis and speed on the $y$-axis. By plotting the given points $(0, 5), (10, 10), (20, 15), (30, 20), (40, 25), (50, 30)$, we get a straight line indicating uniform acceleration.
$(ii)$ The acceleration $(a)$ of the car is equal to the slope of the speed-time graph.
$a = \text{slope} = \frac{v_2 - v_1}{t_2 - t_1}$
Taking two points $(10, 10)$ and $(20, 15)$:
$a = \frac{15 - 10}{20 - 10} = \frac{5}{10} = 0.5 \ m s^{-2}$
Thus, the acceleration of the car is $0.5 \ m s^{-2}$.
$(ii)$ The acceleration $(a)$ of the car is equal to the slope of the speed-time graph.
$a = \text{slope} = \frac{v_2 - v_1}{t_2 - t_1}$
Taking two points $(10, 10)$ and $(20, 15)$:
$a = \frac{15 - 10}{20 - 10} = \frac{5}{10} = 0.5 \ m s^{-2}$
Thus, the acceleration of the car is $0.5 \ m s^{-2}$.
0 likes
View Solution68
Medium
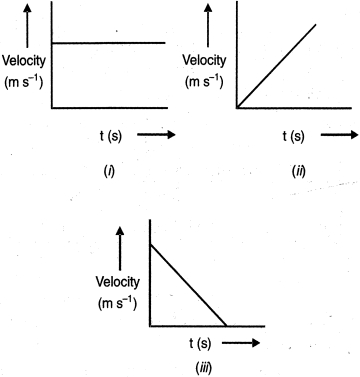
What can you conclude about the motion of a body depicted by the velocity-time graphs $(i)$,$(ii)$ and $(iii)$ given below?
Solution
(N/A) $(i)$ Uniform motion: The velocity-time graph is a straight line parallel to the time axis,indicating that the velocity of the body remains constant over time.
$(ii)$ Uniformly accelerated motion: The velocity-time graph is a straight line passing through the origin (or having a positive slope),indicating that the velocity of the body increases at a constant rate over time.
$(iii)$ Uniformly retarded motion: The velocity-time graph is a straight line with a negative slope,indicating that the velocity of the body decreases at a constant rate over time.
0 likes
View Solution69
Medium
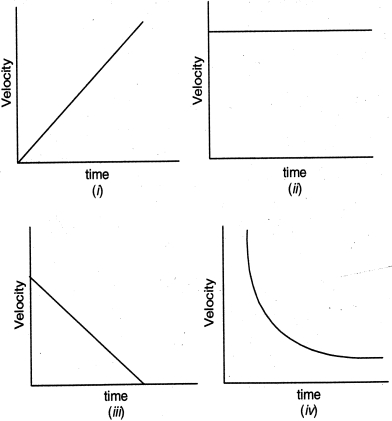
What type of motion is represented by the following graphs?
Solution
(N/A) $(i)$ The velocity-time graph is a straight line passing through the origin,indicating that velocity increases linearly with time. Therefore,it represents uniformly accelerated motion.
$(ii)$ The velocity-time graph is a straight line parallel to the time axis,indicating that velocity remains constant over time. It represents uniform motion (zero acceleration).
$(iii)$ The velocity-time graph is a straight line with a negative slope,indicating that velocity decreases linearly with time. It represents uniformly retarded motion (uniform deceleration).
$(iv)$ The velocity-time graph is a curve with a negative slope,indicating that the rate of decrease of velocity is not constant. It represents non-uniformly retarded motion.
0 likes
View Solution70
Medium
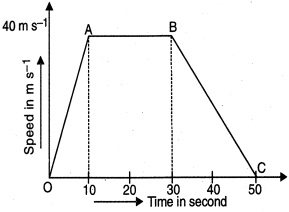
Study the speed-time graph of a car given below and answer the questions that follow:
$(i)$ What type of motion is represented by $OA$?
(ii) What type of motion is represented by $AB$?
(iii) What type of motion is represented by $BC$?
(iv) What is the acceleration of the car from $O$ to $A$?
$(v)$ What is the acceleration of the car from $A$ to $B$?
(vi) What is the retardation of the car from $B$ to $C$?
Solution
(N/A) $(i)$ The speed-time graph is a straight line inclined to the time axis from $O$ to $A$. This represents a uniformly accelerated motion.
(ii) The speed-time graph is a straight line parallel to the time axis from $A$ to $B$. This represents uniform motion (constant speed).
(iii) The speed-time graph is a straight line from $B$ to $C$ having a negative slope. This represents a uniformly retarded motion.
(iv) Change in speed $= 40 - 0 = 40 \ m \ s^{-1}$.
Change in time $= 10 - 0 = 10 \ s$.
Acceleration $a = \frac{\text{Change in speed}}{\text{Change in time}} = \frac{40}{10} = 4 \ m \ s^{-2}$.
$(v)$ Since the motion is uniform (constant speed),the acceleration $a = 0 \ m \ s^{-2}$.
(vi) Change in speed $= 0 - 40 = -40 \ m \ s^{-1}$.
Change in time $= 50 - 30 = 20 \ s$.
Retardation $= -(\text{Acceleration}) = -(\frac{0 - 40}{50 - 30}) = -(\frac{-40}{20}) = -(-2) = 2 \ m \ s^{-2}$.
0 likes
View Solution71
Easy
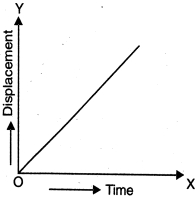
What conclusion can you draw from the displacement$-$time graph of a body shown below?
Solution
(N/A) The displacement$-$time graph is a straight line passing through the origin.
In a displacement$-$time graph,the slope represents the velocity of the body.
Since the slope of a straight line is constant,the velocity of the body is constant.
Therefore,the body is moving with uniform velocity.
In a displacement$-$time graph,the slope represents the velocity of the body.
Since the slope of a straight line is constant,the velocity of the body is constant.
Therefore,the body is moving with uniform velocity.
0 likes
View Solution72
EasyMCQ
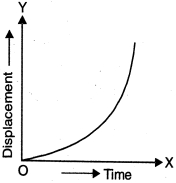
What conclusion can you draw from the displacement$-$time graph of a body as shown below?
A
The body is at rest.
B
The body is moving with uniform velocity.
C
The body is moving with non$-$uniform velocity (accelerated motion).
D
The body is moving with constant acceleration.
Solution
(C) In a displacement$-$time graph,the slope represents the velocity of the body.
For a straight line graph,the slope is constant,which indicates uniform velocity.
However,in the given graph,the curve indicates that the slope is changing at every point.
$A$ changing slope means the velocity of the body is changing over time.
Therefore,a curved displacement$-$time graph represents non$-$uniform motion or accelerated motion.
0 likes
View Solution73
EasyMCQ
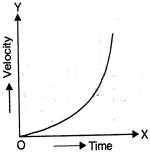
The velocity-time graph of a body is as shown. What type of motion does the body possess?
A
Uniform motion
B
Uniform acceleration
C
Non-uniform acceleration
D
Constant velocity
Solution
(C) The velocity-time graph is a curved line,which indicates that the velocity of the body is changing non-uniformly with time.
Since the rate of change of velocity (acceleration) is not constant,the body is undergoing non-uniform acceleration (also known as variable acceleration).
Since the rate of change of velocity (acceleration) is not constant,the body is undergoing non-uniform acceleration (also known as variable acceleration).
0 likes
View Solution74
Medium
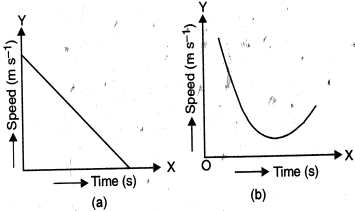
Identify what the graphs shown below indicate.
Solution
(N/A) Graph $(a)$ represents a speed-time graph where the speed decreases linearly with time. This indicates constant retardation (negative acceleration).
Graph $(b)$ represents a speed-time graph where the speed decreases non-linearly and then increases. This indicates non-uniform retardation followed by non-uniform acceleration.
Graph $(b)$ represents a speed-time graph where the speed decreases non-linearly and then increases. This indicates non-uniform retardation followed by non-uniform acceleration.
0 likes
View Solution75
Medium
$A$ truck is moving on a straight road with uniform acceleration. The following table gives the speed of the truck at various instants of time.
Draw the speed-time graph by choosing a convenient scale. Determine from it:
$(i)$ The acceleration of the truck.
$(ii)$ The distance travelled by the truck in $50$ seconds.
| Speed $(m s^{-1})$ | $5$ | $10$ | $15$ | $20$ | $25$ | $30$ |
| Time $(s)$ | $0$ | $10$ | $20$ | $30$ | $40$ | $50$ |
Draw the speed-time graph by choosing a convenient scale. Determine from it:
$(i)$ The acceleration of the truck.
$(ii)$ The distance travelled by the truck in $50$ seconds.
Solution
(N/A) The speed-time graph is a straight line starting from $(0, 5)$ to $(50, 30)$.
$(i)$ Acceleration is the slope of the speed-time graph.
Slope $= \frac{\text{Change in speed}}{\text{Change in time}} = \frac{30 - 5}{50 - 0} = \frac{25}{50} = 0.5 \ m s^{-2}$.
$(ii)$ The distance travelled is the area under the speed-time graph.
This area forms a trapezium with parallel sides of length $5 \ m s^{-1}$ and $30 \ m s^{-1}$, and height (time) of $50 \ s$.
Area $= \frac{1}{2} \times (\text{sum of parallel sides}) \times \text{height}$
Area $= \frac{1}{2} \times (5 + 30) \times 50 = \frac{1}{2} \times 35 \times 50 = 35 \times 25 = 875 \ m$.
0 likes
View Solution76
MediumMCQ
$A$ particle accelerates from rest at a constant rate for some time and attains a constant velocity of $8\, m s^{-1}$. Afterwards,it decelerates at a constant rate and comes to rest. If the total time taken is $4\, s$,the distance travelled is:
A
$32\, m$
B
$16\, m$
C
$4\, m$
D
Insufficient data
Solution
(B) Let the time taken for acceleration be $t_1$ and the time taken for deceleration be $t_2$.
Given,total time $T = t_1 + t_2 = 4\, s$.
The velocity-time graph for this motion is a triangle with base $T = 4\, s$ and height $v_{max} = 8\, m s^{-1}$.
The distance travelled is equal to the area under the velocity-time graph.
Area $= \frac{1}{2} \times \text{base} \times \text{height}$.
Area $= \frac{1}{2} \times 4\, s \times 8\, m s^{-1} = 16\, m$.
Thus,the total distance travelled is $16\, m$.
0 likes
View Solution77
EasyMCQ
The area under the velocity$-$time graph gives the value of
A
velocity
B
acceleration
C
distance travelled
D
none of these
Solution
(C) The area under a velocity$-$time graph represents the displacement or the total distance travelled by an object.
Mathematically,for a velocity $v$ and time $t$,the area is calculated as $\int v \, dt$,which corresponds to the displacement of the object over the given time interval.
Mathematically,for a velocity $v$ and time $t$,the area is calculated as $\int v \, dt$,which corresponds to the displacement of the object over the given time interval.
0 likes
View Solution78
EasyMCQ
The speed-time graph of a body is a straight line parallel to the time axis. The body has:
A
uniform acceleration
B
uniform speed
C
variable speed
D
variable acceleration
Solution
(B) In a speed-time graph,the $y$-axis represents speed and the $x$-axis represents time.
If the graph is a straight line parallel to the time axis,it means that the speed of the body remains constant at all points in time.
$A$ constant speed indicates that the body is moving with uniform speed (or constant velocity if the direction is fixed).
Since the speed does not change over time,the acceleration of the body is zero.
0 likes
View Solution79
EasyMCQ
The velocity$-$time graph of a body has a negative slope. The body is undergoing
A
uniform acceleration
B
variable acceleration
C
uniform retardation
D
variable retardation
Solution
(C) In a velocity$-$time graph,the slope represents the acceleration of the body.
If the slope is negative,it indicates that the velocity of the body is decreasing over time.
$A$ constant negative slope implies that the rate of decrease in velocity is uniform.
This phenomenon is known as uniform retardation or uniform deceleration.
Therefore,the correct option is $C$.
If the slope is negative,it indicates that the velocity of the body is decreasing over time.
$A$ constant negative slope implies that the rate of decrease in velocity is uniform.
This phenomenon is known as uniform retardation or uniform deceleration.
Therefore,the correct option is $C$.
0 likes
View Solution80
EasyMCQ
The distance$-$time graph of a body is parallel to the time axis. The body is
A
cannot say
B
in variable motion
C
in uniform motion
D
at rest
Solution
(D) In a distance$-$time graph,the $y$-axis represents the distance covered and the $x$-axis represents time.
If the graph is parallel to the time axis ($x$-axis),it means that as time increases,the distance covered by the body remains constant.
$A$ constant distance indicates that the body is not changing its position with respect to time.
Therefore,the body is at rest.
If the graph is parallel to the time axis ($x$-axis),it means that as time increases,the distance covered by the body remains constant.
$A$ constant distance indicates that the body is not changing its position with respect to time.
Therefore,the body is at rest.
0 likes
View Solution81
EasyMCQ
The distance-time graph of a body is a straight line inclined to the time axis. The body is in:
A
uniform motion
B
uniformly accelerated motion
C
uniformly retarded motion
D
rest position
Solution
(A) In a distance-time graph,the slope of the line represents the speed of the object.
If the graph is a straight line inclined to the time axis,it indicates that the object covers equal distances in equal intervals of time.
This constant slope implies a constant speed.
Therefore,the body is in uniform motion.
If the graph is a straight line inclined to the time axis,it indicates that the object covers equal distances in equal intervals of time.
This constant slope implies a constant speed.
Therefore,the body is in uniform motion.
0 likes
View Solution82
EasyMCQ
The area under a velocity$-$time graph is equal to the
A
speed of the body
B
magnitude of the displacement of the body
C
distance travelled by the body
D
none of these
Solution
(B) The area under a velocity$-$time graph represents the displacement of the object.
Velocity is defined as the rate of change of displacement $(v = \frac{ds}{dt})$.
Therefore,the displacement $(s)$ can be calculated by integrating the velocity with respect to time: $s = \int v \, dt$.
Geometrically,this integral corresponds to the area enclosed between the velocity$-$time curve and the time axis.
If the motion is in a straight line without changing direction,the magnitude of displacement is equal to the distance travelled. However,in general,the area under the velocity$-$time graph represents the magnitude of the displacement.
0 likes
View Solution83
EasyMCQ
Area under a speed-time graph is equal to the
A
velocity of the body
B
magnitude of the displacement
C
distance travelled by the body
D
none of these
Solution
(C) The area under a speed-time graph represents the total distance covered by an object.
Since speed is a scalar quantity (distance/time),the area calculated by multiplying speed and time gives the total distance travelled.
In contrast,the area under a velocity-time graph represents the displacement of the body.
Therefore,for a speed-time graph,the correct answer is the distance travelled by the body.
0 likes
View SolutionMOTION — Graphical Representation of Motion · Frequently Asked Questions
1Are these MOTION questions useful for JEE and NEET?
Yes. All questions in this section are mapped to JEE Main and NEET exam patterns. Previous year questions from JEE Main, NEET, GUJCET and state-level exams are included with full solutions.
2Can I switch to Hindi or Gujarati for these questions?
Yes. Use the language tabs in the hero section or the sidebar to view the same questions and solutions in English, Hindi or Gujarati.
3How do I generate a question paper from this subtopic?
Use the Vedclass Exam Paper Generator — select the chapter and subtopic, set difficulty, and generate Sets A, B, C, D automatically. First 3 chapters of every subject are free.
Vedclass Products
For Students
Vedclass Test Series
Mock tests in real JEE/NEET style with performance analysis. 5-day free trial.
Start Free TrialFor Teachers
Exam Paper Generator
Generate Set A/B/C/D papers from this chapter in 2 minutes. 3 chapters free.
Try FreeFor Institutes
Online Exam Module
Live online exams with unlimited students, 360° analytics & white-label branding.
See DemoFor Teachers & Institutes
Generate a MOTION Exam Paper in 2 Minutes
Select subtopic & difficulty — Sets A, B, C, D auto-generated with No Repeat logic.
First 3 chapters of every subject are free — no payment required.